
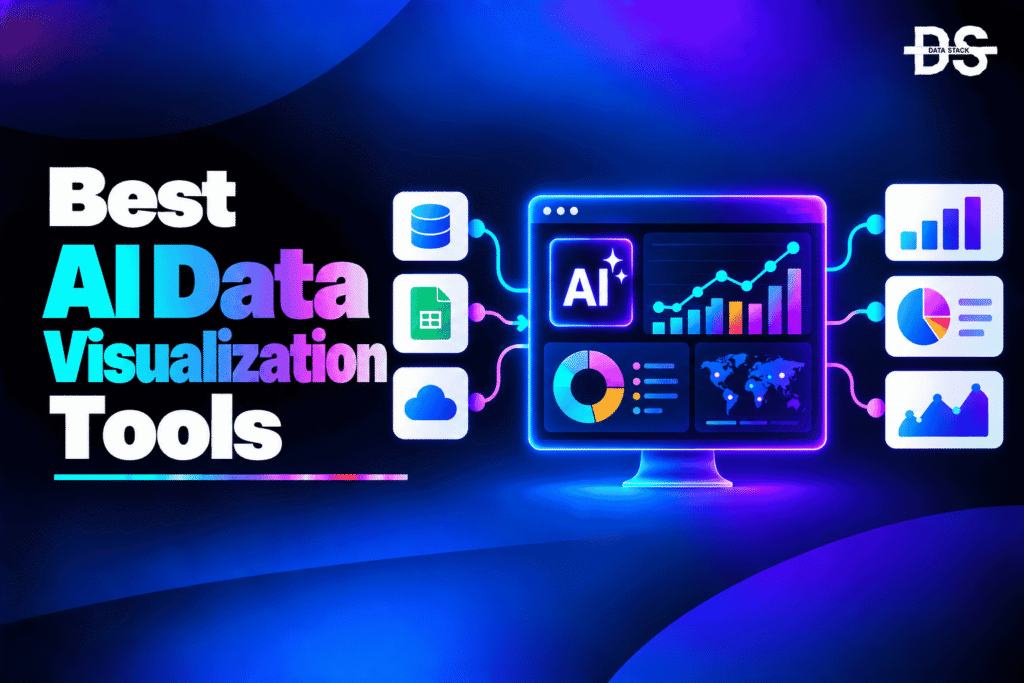
Data visualization helps businesses turn complex datasets into charts, graphs, dashboards, and reports that are easier to understand. However, creating useful visualizations still requires users to select the right data, choose appropriate charts, build dashboards, and analyze the results. AI data visualization tools simplify many of these tasks by using artificial intelligence to help users create and explore visualizations faster.
Modern AI-powered data visualization tools allow users to describe what they want to analyze in natural language and generate charts or dashboards without manually configuring every element. Depending on the platform, AI can also recommend suitable visualizations, generate SQL or analytical code, identify trends and anomalies, summarize findings, and help users modify visualizations through follow-up prompts.
These capabilities make AI data visualization useful for both technical and non-technical users. Business teams can create visual reports without relying on analysts for every request, while data professionals can use AI to reduce repetitive work involved in querying data, building charts, and exploring different views. The right platform can also make it easier to move from a raw dataset to an understandable visual story without requiring advanced visualization skills for every task.
In this guide, we compare the best AI data visualization tools based on their AI capabilities, automation features, visualization capabilities, and ideal use cases. We also cover their key AI-focused features, compare them side by side, explain how to choose the right tool, and answer common questions about AI-powered data visualization.
What Are AI Data Visualization Tools?
AI data visualization tools are software platforms that use artificial intelligence to help users create, analyze, and interact with charts, graphs, dashboards, and other visual representations of data. They can assist with tasks such as selecting visualizations, generating charts from natural-language instructions, analyzing patterns, and creating data-driven reports.
Unlike traditional data visualization tools, which generally require users to manually select datasets, configure charts, apply filters, and build dashboards, AI-powered tools can understand natural-language requests and automate parts of these workflows. A user can describe the information they want to visualize, and the AI can help determine the relevant data and generate an appropriate visual output.
AI data visualization tools can also support the analysis that happens after a chart is created. Depending on the platform, AI can identify trends, highlight unusual changes, explain visualizations, answer follow-up questions, or recommend additional ways to explore the data. This makes AI useful not only for creating charts but also for understanding what the visualized data means.
AI Data Visualization Tools vs. Traditional Data Visualization Tools
| Capability | Traditional Data Visualization Tools | AI Data Visualization Tools |
|---|---|---|
| Chart creation | Manually configure charts | Generate charts from natural-language requests |
| Chart selection | User chooses the chart type | AI can recommend suitable visualizations |
| Data exploration | Manual filtering and analysis | AI-assisted exploration |
| Dashboard creation | Manually build and arrange dashboards | AI can assist with dashboard creation |
| Insight generation | User interprets the data | AI can identify and summarize patterns |
| SQL generation | Often requires manual SQL | AI can generate SQL from natural-language requests |
| Visualization changes | Manually adjust chart settings | Modify visualizations using AI prompts |
| Reporting | Manual report creation | AI-assisted summaries and reports |
| Anomaly detection | Manual analysis or predefined rules | AI-assisted pattern and anomaly detection |
| Follow-up analysis | Create new queries manually | Conversational data exploration |
AI Data Visualization Tools Comparison
The table below compares the leading AI data visualization tools based on their AI capabilities, automation features, best use cases, and G2 ratings.
| Tool | AI Capabilities | What You Can Automate | Best For | G2 Rating |
|---|---|---|---|---|
| Julius AI | Natural-language analysis, AI chart generation, automated insights | Data analysis, charts, visual reports | AI-powered data analysis and visualization | 4.5/5 |
| Microsoft Power BI | Copilot, natural-language analytics, AI-assisted visualization | Reports, charts, summaries, analysis | Enterprise BI and Microsoft users | 4.5/5 |
| Tableau | AI-assisted analytics, natural-language interaction, automated insights | Visualization, analysis, reporting | Enterprise visual analytics | 4.4/5 |
| ThoughtSpot | AI search, natural-language analytics, AI-generated insights | Charts, dashboards, data exploration | Self-service analytics | 4.4/5 |
| Zoho Analytics | Zia AI, conversational analytics, automated insights | Dashboards, reports, analysis | Self-service business analytics | — |
| Domo | AI analytics, natural-language interaction, automated insights | Dashboards, reporting, analysis | Business and operational analytics | — |
| Hex | AI analysis, SQL generation, AI-assisted workflows | Queries, analysis, charts | Data teams and analysts | 4.6/5 |
| Apache Superset | AI-assisted chart and dashboard creation | Charts, dashboards, SQL workflows | Open-source data visualization | — |
8 Best AI Data Visualization Tools
Let’s take a detailed look at the 8 best AI data visualization tools, including their key features, AI capabilities, and best use cases.
#1. Julius AI
Julius AI is an AI-powered data analysis platform that lets users work with datasets through natural-language instructions. Instead of manually writing code or configuring every visualization, users can ask questions about their data and have the platform perform analysis and create visual outputs. It is designed to make data analysis accessible to users who may not have advanced SQL, Python, or data visualization skills.
Its AI capabilities extend beyond simply creating charts. Julius AI can interpret analytical questions, analyze datasets, generate visualizations, and help users investigate the results through follow-up questions. This makes it useful for exploratory analysis where users want to move quickly from a question to a visual answer without manually building the entire analytical workflow.
Julius AI is particularly useful for users who want an AI-first approach to data visualization. Business users, researchers, analysts, and other data-focused professionals can use natural-language prompts to explore datasets, identify patterns, create charts, and communicate findings without having to build each analytical step manually.
Key Features
- Natural-Language Data Visualization: Users can describe the chart or analysis they need in plain language, allowing AI to interpret the request and create an appropriate visual output.
- AI Chart Generation: Julius AI can generate charts from datasets based on the user’s analytical question, reducing the manual work involved in selecting fields and configuring visualizations.
- AI-Powered Data Analysis: The platform can analyze datasets alongside visualization tasks, helping users identify trends, relationships, and other useful patterns before presenting the results visually.
- Automated Data Exploration: Users can ask questions about a dataset and use AI to explore different aspects of the information without manually creating separate queries for every investigation.
- AI-Generated Insights: AI can identify potentially important findings in a dataset and explain them in natural language, giving users more context around the resulting visualization.
- Conversational Analysis: Users can ask follow-up questions about an existing analysis, allowing them to refine their investigation without restarting the workflow.
- AI-Assisted Statistical Analysis: Julius AI can assist with analytical and statistical tasks that support visualization, allowing users to go beyond basic chart creation.
- AI-Assisted Reporting: The platform can help turn analytical findings into understandable visual and written outputs that are easier to communicate to others.
G2 Rating: 4.5/5
Showcase your software to buyers actively comparing tools. Submit your product for editorial review and get featured on Data Stack Hub.
Submit Your Tool →#2. Microsoft Power BI
Microsoft Power BI is a business intelligence and data visualization platform that combines dashboards, reports, data modeling, and analytics with AI-powered capabilities. It is widely used by organizations to connect business data, create interactive visualizations, and distribute analytical information across teams.
Power BI’s AI capabilities allow users to interact with data using natural language and use Copilot to assist with analytical and reporting workflows. AI can help users understand reports, generate summaries, explore data, and accelerate the creation of analytical content. This reduces some of the manual work traditionally involved in building and interpreting business intelligence reports.
For organizations already using Microsoft’s data ecosystem, Power BI provides a practical way to introduce AI into existing visualization workflows. Teams can continue using their established datasets, models, dashboards, and reporting processes while adding AI assistance for analysis and visualization.
Key Features
- Copilot for Data Analysis: Power BI’s Copilot capabilities can help users analyze data and work with reports using natural-language instructions rather than manually performing every analytical step.
- Natural-Language Data Questions: Users can ask questions about business data in natural language, allowing AI to help identify relevant information and produce analytical responses.
- AI-Assisted Report Creation: Copilot can assist with creating and working with report content, helping users move faster when developing analytical reports.
- AI-Generated Summaries: AI can summarize information from reports and datasets, making important findings easier to understand without requiring users to inspect every visualization individually.
- AI-Assisted Visualization: AI can help users work from analytical questions toward appropriate visual representations, reducing some of the manual configuration involved in creating reports.
- Conversational Analytics: Users can interact with their analytical content through follow-up questions, making it easier to investigate specific trends or metrics.
- AI-Powered Data Exploration: AI assistance can help users explore business data and identify relevant information within existing Power BI models and reports.
- Enterprise Analytics Integration: Power BI combines AI capabilities with data models, dashboards, security, reporting, and Microsoft’s broader business data ecosystem.
G2 Rating: 4.5/5
Also Read: Best Power BI Alternatives and Competitors
#3. Tableau
Tableau is a business intelligence and data visualization platform that helps organizations analyze data through interactive charts, dashboards, and visual reports. It has added AI capabilities to its established visualization environment, allowing users to combine traditional visual analytics with natural-language interaction and AI-assisted analysis.
Tableau’s AI capabilities can help users explore data, generate summaries, ask questions, and accelerate analytical workflows. Rather than manually navigating through every dataset and visualization, users can use natural-language interaction to investigate business questions and receive AI-assisted responses based on available data.
The combination of AI and Tableau’s established visualization capabilities makes it particularly useful for enterprise analytics teams. Analysts can continue using advanced visualization and data exploration features while business users can take advantage of AI-assisted workflows to investigate data and understand analytical results more quickly.
Key Features
- AI-Assisted Data Analysis: Tableau uses AI to assist with data exploration and analysis, helping users identify useful information without manually performing every analytical step.
- Natural-Language Analytics: Users can ask questions about data using natural language, making it easier to investigate metrics and trends without manually constructing every query.
- AI-Generated Insights: AI can help identify patterns and notable changes in data, giving users additional context while exploring visualizations.
- AI-Assisted Visualization: AI capabilities can support users in moving from analytical questions to relevant visual representations of the underlying data.
- Automated Data Summaries: AI can summarize analytical information in natural language, helping users quickly understand what a report or visualization is showing.
- Conversational Data Exploration: Users can continue an analysis through follow-up questions, allowing them to investigate related metrics and dimensions without starting from scratch.
- AI-Assisted Reporting: AI can support reporting workflows by helping users interpret analytical content and communicate important findings.
- Enterprise Visual Analytics: Tableau combines AI assistance with advanced visualization, dashboards, analytics, and enterprise data workflows.
G2 Rating: 4.4/5
Also Read: Best Tableau Alternatives and Competitors
#4. ThoughtSpot
ThoughtSpot is an AI-powered analytics platform focused on search-based and conversational data exploration. It allows users to ask questions about business data in natural language and receive visual analytical answers. Instead of relying entirely on predefined dashboards, users can interact directly with data and investigate questions as they arise.
Its AI capabilities help interpret natural-language questions, identify relevant data, and generate visual responses. Users can continue asking questions about the results, allowing them to drill into trends, compare segments, and investigate changes without manually creating a new report for every question.
ThoughtSpot is particularly suited to organizations that want to make analytics more accessible to business users. Its AI-first approach can reduce the technical barrier to data exploration while still providing interactive visual analytics for teams that need to investigate business performance.
Key Features
- AI-Powered Search: ThoughtSpot uses AI to interpret natural-language questions and identify relevant business data for analysis.
- Natural-Language Visualization: Users can describe what they want to understand, and AI can turn those requests into visual analytical results.
- AI-Generated Insights: AI can surface patterns and notable information within data, helping users identify areas that deserve further investigation.
- Conversational Analytics: Users can ask follow-up questions about visual results, creating an interactive analytical workflow rather than relying on static dashboards.
- AI-Assisted Chart Creation: AI can help transform analytical questions into appropriate charts and visual views.
- Automated Data Exploration: Users can explore different metrics and dimensions through natural-language requests without manually constructing each analysis.
- AI-Powered Dashboard Experience: AI-assisted analytics can complement dashboards by allowing users to investigate questions beyond the information included in predefined reports.
- Embedded Analytics: ThoughtSpot can bring AI-powered data exploration into applications and workflows where users need access to business insights.
G2 Rating: 4.4/5
#5. Zoho Analytics
Zoho Analytics is a self-service business intelligence and data analytics platform that provides dashboards, reports, data visualization, and AI-assisted analytics. Its Zia AI capabilities allow users to interact with data using natural language and receive analytical responses without manually building every query or visualization.
Zia can assist with asking questions about data, generating insights, and exploring business information. This makes it possible for users to move from a business question to a visualization or analytical answer with less manual configuration. Users can also work with existing dashboards and reports while using AI to investigate specific metrics or trends.
Zoho Analytics is particularly suitable for businesses that want AI-powered visualization without adopting a highly technical analytics environment. It combines self-service BI with conversational analytics, making it useful for business teams that need to create reports and understand data without depending entirely on data specialists.
Key Features
- Zia AI Analytics: Zia provides AI-powered assistance for analyzing business data and helping users find relevant information through natural-language interaction.
- Natural-Language Data Questions: Users can ask questions about their datasets and business metrics in natural language rather than manually constructing every analytical query.
- AI-Powered Chart Creation: AI can help generate visual representations from analytical requests, reducing the effort required to manually configure charts.
- Automated Insights: AI can identify useful patterns and findings in business data, helping users discover information that may require more manual investigation.
- Conversational Analytics: Users can continue an analysis with follow-up questions, allowing them to explore related metrics and findings interactively.
- AI Data Summaries: AI can explain or summarize analytical results, making reports and visualizations easier for business users to understand.
- AI-Assisted Reporting: AI capabilities can support report creation and interpretation, reducing repetitive work involved in preparing business reports.
- Self-Service Visual Analytics: The combination of AI and self-service BI allows business users to explore and visualize data without requiring advanced technical skills for every task.
G2 Rating: —
Also Read: Best 10 Zoho Analytics Alternatives and Competitors
Increase your product visibility by reaching software buyers researching the best tools. Every submission is reviewed by our editorial team.
Feature My Tool →#6. Domo
Domo is a cloud-based business intelligence and data analytics platform that combines data integration, dashboards, reporting, and visualization with AI-powered capabilities. It is designed to bring data from multiple sources into a centralized environment where business teams can monitor performance and analyze information.
Domo’s AI capabilities support natural-language interaction, data analysis, automated insights, and AI-assisted reporting. Users can ask questions about their data and use AI to explore metrics, identify patterns, and understand business performance without manually building every analytical view.
The platform is particularly useful for organizations that want to combine AI-assisted visualization with broader business and operational analytics. Instead of using AI only to create individual charts, teams can incorporate AI into dashboards, reporting, data exploration, and ongoing performance analysis.
Key Features
- AI-Powered Data Analysis: Domo uses AI to help users analyze business information and identify relevant patterns within connected datasets.
- Natural-Language Analytics: Users can ask questions about their business data using natural language, allowing AI to assist with the underlying analytical process.
- AI-Generated Insights: AI can surface potentially important trends and changes, helping teams identify areas that need additional investigation.
- AI-Assisted Visualization: AI can support the process of turning analytical questions into visual outputs that help users understand business information.
- Conversational Data Exploration: Users can ask follow-up questions and continue exploring the same analytical topic without manually rebuilding each analysis.
- Automated Data Summaries: AI can summarize important information from analytical results and reports, making large amounts of business data easier to interpret.
- AI-Assisted Reporting: AI can help accelerate reporting workflows by assisting with the interpretation and communication of business information.
- Business Analytics Integration: AI visualization capabilities work alongside dashboards, data integration, reporting, and broader business intelligence workflows.
G2 Rating: —
Also Read: Best Domo Alternatives and Competitors
#7. Hex
Hex is an analytics workspace that combines SQL, Python, notebooks, visualization, and AI-assisted data analysis. It is designed primarily for data analysts, analytics engineers, and data teams that need greater control over the underlying analytical workflow while still benefiting from generative AI.
Hex’s AI capabilities can help users generate SQL and analytical code, explore datasets, answer data questions, and create visual outputs. Users can describe the analysis they need and use AI to accelerate the technical work behind it, while retaining the ability to inspect and modify the resulting SQL, Python, and analytical workflow.
This makes Hex different from visualization platforms aimed primarily at business users. It is better suited to teams that want AI assistance without giving up technical control. Analysts can combine AI with notebooks, SQL, Python, and interactive visualizations to build more detailed analytical workflows.
Key Features
- AI SQL Generation: Hex can help generate SQL from natural-language analytical requests, reducing the time required to write queries manually.
- AI-Assisted Data Analysis: AI can support users as they explore datasets, investigate questions, and build analytical workflows.
- AI Code Generation: Data teams can use AI assistance to generate or modify analytical code, helping reduce repetitive programming work.
- AI-Powered Visualization: AI can help users move from an analytical request to charts and visual outputs within the same analytical environment.
- Natural-Language Data Exploration: Users can describe analytical questions in plain language and use AI to investigate the underlying data.
- Conversational Analysis: Follow-up questions allow users to refine an analysis and investigate additional dimensions without rebuilding the entire workflow.
- AI-Generated Data Summaries: AI can help explain analytical findings and summarize important information from datasets and visualizations.
- Integrated Technical Analytics: AI works alongside SQL, Python, notebooks, and visualization capabilities, giving data teams control over the full analytical workflow.
G2 Rating: 4.6/5
#8. Apache Superset
Apache Superset is an open-source business intelligence and data visualization platform used to explore datasets, create charts, and build interactive dashboards. Unlike commercial AI-first analytics products, Superset provides an open-source visualization environment that organizations can extend and integrate with their own AI workflows.
Its current AI capabilities can be used through an MCP integration that allows AI assistants to interact with Superset. This can support natural-language workflows such as exploring datasets, generating charts, modifying visualizations, creating dashboards, and working with SQL. This gives teams a way to add AI-assisted visualization to an open-source BI environment.
Superset is particularly useful for organizations that want greater control over their visualization stack or prefer open-source software. Its AI capabilities are best understood as an extension of the platform rather than a fully AI-native analytics experience, but the ability to use natural language for chart and dashboard workflows makes it a relevant option for this category.
Key Features
- AI-Assisted Chart Creation: AI assistants can help users create charts from natural-language instructions, reducing the manual configuration required for visualization.
- Natural-Language Data Exploration: Users can interact with datasets through AI-assisted workflows rather than relying entirely on manual navigation and query construction.
- AI Dashboard Creation: AI can assist with creating dashboards based on natural-language requirements, helping users assemble visual analytics more efficiently.
- AI Visualization Modification: Existing visualizations can be modified through natural-language instructions, allowing users to change analytical views without manually adjusting every setting.
- AI SQL Assistance: AI-assisted workflows can help users work with SQL when creating or exploring visualizations.
- Conversational Analytics: Users can interact with an AI assistant to investigate datasets and continue analytical tasks through natural-language requests.
- Open-Source Visualization: Superset provides an open-source foundation, giving organizations more control over how the visualization platform is deployed and integrated.
- AI-Integrated BI Workflows: AI capabilities can operate alongside Superset’s existing charts, dashboards, datasets, and SQL-based analytics environment.
G2 Rating: —
Also Read: Best Apache Superset Alternatives
How to Choose the Right AI Data Visualization Tool
- AI Visualization Capabilities: Look for tools that can create or modify charts using natural-language prompts instead of only adding AI-generated text around existing dashboards.
- Natural-Language Queries: Choose a platform that can understand business questions and turn them into useful visualizations or analytical results without requiring users to write every query manually.
- Data Source Support: Check whether the tool connects to your databases, data warehouses, spreadsheets, cloud platforms, and other sources without requiring major changes to your existing data stack.
- AI-Powered Insights: Prioritize tools that can identify trends, patterns, anomalies, and important changes in the data rather than simply generating charts.
- Dashboard Automation: If your team creates dashboards regularly, look for AI capabilities that can help generate, update, or customize dashboards based on natural-language requirements.
- Visualization Recommendations: The tool should be able to recommend appropriate chart types based on the data and the question being analyzed rather than producing the same visualization for every request.
- Conversational Analytics: Follow-up questions are important for exploratory analysis. Choose a tool that lets users continue investigating the same dataset or visualization through natural-language prompts.
- Technical Control: Data analysts may need access to SQL, Python, data models, calculations, and the underlying queries. Consider how much control the platform provides alongside its AI features.
- Data Security and Governance: For business and enterprise data, evaluate access controls, permissions, governance, sensitive-data handling, and how AI interacts with connected datasets.
- Accuracy and Validation: AI-generated charts and insights should be easy to verify against the underlying data. Choose a platform that allows users to inspect the source data, queries, calculations, and methodology behind important results.
Browse expertly curated software recommendations across hundreds of business categories.
Browse Top Tools →Conclusion
AI data visualization tools are making it easier to move from a business question or raw dataset to an understandable visual representation. Instead of manually selecting fields, writing queries, configuring charts, and building every dashboard from scratch, users can increasingly rely on natural-language instructions and AI assistance to accelerate these workflows.
The tools covered in this list take different approaches to AI-powered visualization. Julius AI focuses heavily on conversational data analysis, while Power BI, Tableau, ThoughtSpot, Zoho Analytics, and Domo combine AI capabilities with broader business intelligence and dashboard functionality. These platforms are particularly useful for organizations that want to make analytics more accessible to business users.
Hex is a stronger choice for technical data teams that want AI assistance alongside SQL, Python, notebooks, and interactive analytics. Apache Superset provides an open-source alternative for organizations that want AI-assisted chart and dashboard workflows while retaining greater control over their BI infrastructure.
The best AI data visualization tool ultimately depends on how your team works with data. Business users may prioritize natural-language queries and automated insights, while analysts may need SQL generation, data exploration, and control over the analytical workflow. Enterprise teams should also consider security, governance, data connectivity, and the ability to validate AI-generated results.
AI should not be treated as a replacement for analytical judgment. A visualization can look accurate while being based on the wrong dataset, metric, calculation, or interpretation. Teams should therefore review important AI-generated visualizations and insights against the underlying data before using them for business decisions.
Frequently Asked Questions
1. What are AI data visualization tools?
AI data visualization tools use artificial intelligence to help users create, analyze, modify, and understand charts, graphs, dashboards, and other visual representations of data. They can support natural-language queries, automated chart creation, insight generation, and conversational data exploration.
2. How do AI data visualization tools work?
These tools combine AI models with datasets, databases, data warehouses, or BI systems. A user can describe what they want to analyze, and the AI interprets the request to generate a query, visualization, dashboard, summary, or other analytical output.
3. Can AI create data visualizations from natural language?
Yes. Many AI visualization tools allow users to describe the information they want to see in plain language. The AI can interpret the request and generate a suitable chart or visual analysis based on the available data.
4. Can AI data visualization tools recommend charts?
Yes. Some tools can analyze the data and analytical question and recommend an appropriate visualization. For example, the AI may determine whether a line chart, bar chart, scatter plot, or another visualization is more suitable for the requested analysis.
5. Can AI data visualization tools create dashboards?
Yes. Depending on the platform, AI can assist with creating dashboards, selecting visualizations, arranging analytical content, and modifying existing dashboards through natural-language instructions.
6. Can AI data visualization tools generate SQL?
Yes. Several AI analytics and visualization platforms can translate natural-language questions into SQL. This allows users to investigate data without manually writing every query.
7. Can AI data visualization tools detect trends and anomalies?
Yes. AI can analyze datasets and visualizations to identify trends, unusual changes, outliers, and other patterns. The exact capabilities vary by platform and the type of data being analyzed.
8. Can non-technical users use AI data visualization tools?
Yes. Natural-language interfaces make AI visualization tools accessible to users who may not know SQL or advanced visualization techniques. However, users still need enough understanding of the underlying business data to validate important results.
9. Are AI-generated visualizations accurate?
Not always. AI can misunderstand a question, select an inappropriate field, use an incorrect calculation, or interpret the data incorrectly. Important visualizations should therefore be checked against the underlying dataset and business definitions.
10. What is the difference between AI data visualization and traditional data visualization?
Traditional data visualization generally requires users to manually select data, configure charts, create filters, and build dashboards. AI data visualization tools can automate or assist with these tasks through natural-language interaction, automated insights, AI-generated queries, and conversational analysis.
11. Can AI data visualization tools analyze Excel and CSV files?
Yes. Several AI-powered analytics platforms support spreadsheet and CSV data. Users can upload or connect datasets and use natural-language prompts to analyze the information and create visualizations, depending on the tool’s supported data sources.
12. Can AI data visualization tools work with databases and data warehouses?
Yes. Enterprise platforms can connect to databases, cloud data warehouses, and other business data sources. The available integrations vary by tool, so organizations should check whether their existing data infrastructure is supported.
13. What are the best AI data visualization tools in 2026?
The leading options covered in this article are Julius AI, Microsoft Power BI, Tableau, ThoughtSpot, Zoho Analytics, Domo, Hex, and Apache Superset. They cover different use cases, from conversational visualization and self-service BI to technical analytics and open-source data visualization.
14. What are AI-powered data visualization tools used for?
AI-powered data visualization tools are used for creating charts, building dashboards, exploring datasets, identifying trends, detecting anomalies, generating insights, analyzing business metrics, creating reports, and answering data questions using natural language.
15. Are there open-source AI data visualization tools?
Yes. Apache Superset is an open-source data visualization and BI platform that can be integrated with AI-assisted workflows for tasks such as exploring datasets, creating charts, modifying visualizations, and building dashboards. It can be a useful option for organizations that want an open-source visualization foundation rather than a fully proprietary platform.