
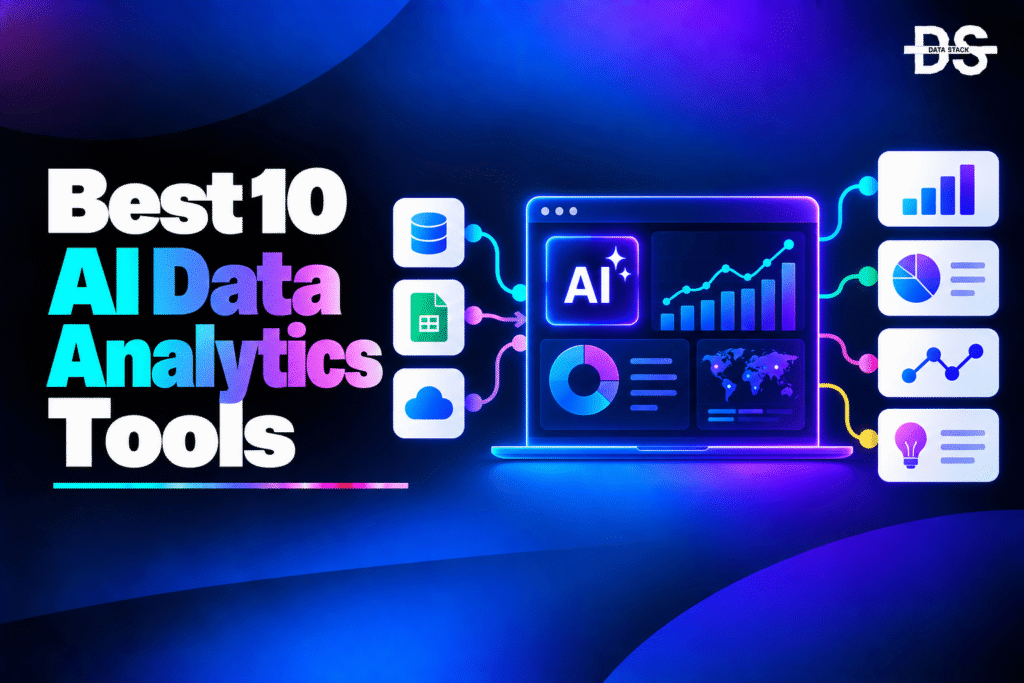
Data analytics traditionally requires users to collect data, write queries, build reports, create visualizations, and interpret the results. AI data analytics tools are changing this workflow by using artificial intelligence to automate parts of the analytical process and make data insights more accessible. Users can increasingly ask questions in natural language, generate analyses, identify patterns, and create visualizations without performing every step manually.
Modern AI-powered analytics platforms go beyond simple chatbot interfaces. They can generate SQL and analytical code, explore datasets, summarize findings, identify trends and anomalies, recommend visualizations, and help users investigate follow-up questions. Some tools are designed for professional data analysts, while others focus on enabling business users to perform self-service analytics without extensive technical skills.
AI also changes how users interact with analytical results. Instead of examining dashboards and deciding manually which metrics require attention, AI can surface notable changes and explain potential patterns in the underlying data. More advanced platforms can combine natural-language interaction with governed business metrics, enterprise data sources, and existing analytics workflows.
However, AI-generated analysis still needs validation. An AI system may identify a real pattern but interpret it incorrectly, use an inappropriate metric, or overlook important context in the underlying data. The most useful AI data analytics tools therefore combine AI automation with transparent data workflows, human review, reliable data sources, and appropriate governance.
What Are AI Data Analytics Tools?
AI data analytics tools are software platforms that use artificial intelligence to help users collect, query, analyze, visualize, and interpret data. They can automate analytical tasks that traditionally require SQL, spreadsheets, statistical analysis, dashboards, or specialized business intelligence skills.
One of the most common capabilities is natural-language analytics. Instead of manually creating a query or selecting multiple filters, users can ask questions such as “What were our highest-growth customer segments this quarter?” The AI can interpret the question, identify relevant data, perform the analysis, and present the results in a format that users can understand.
AI analytics tools can also assist professional analysts and data teams. They can generate SQL or Python code, explain analytical results, identify anomalies, summarize large datasets, recommend visualizations, and accelerate repetitive reporting tasks. This allows experienced analysts to spend more time on interpretation and decision support rather than manually completing every analytical step.
AI Data Analytics Tools vs. Traditional Data Analytics Tools
| Capability | Traditional Data Analytics Tools | AI Data Analytics Tools |
|---|---|---|
| Data querying | Manual SQL or visual query building | Natural-language and AI-assisted queries |
| Data exploration | Manual filtering and investigation | AI-assisted exploration |
| Insight generation | Analyst-driven | AI-generated insights and summaries |
| Visualization | Manually created | AI-assisted visualization |
| Anomaly detection | Rules and manual analysis | AI-based pattern detection |
| Report generation | Manual | AI-assisted reporting |
| Data interpretation | Human-led | AI-assisted interpretation |
| Follow-up analysis | New manual queries | Conversational analysis |
AI Data Analytics Tools Comparison
The comparison table below provides a quick overview of the best AI data analytics tools, highlighting their AI capabilities, automation features, best use cases, and G2 ratings.
These AI data analytics tools differ in how they use AI for natural-language analysis, automated insights, data visualization, query generation, reporting, and business intelligence.
| Tool | AI Capabilities | What You Can Automate | Best For | G2 Rating |
|---|---|---|---|---|
| ThoughtSpot | AI search, natural-language analytics, AI insights | Data querying, insights, visualization | Enterprise self-service analytics | 4.5/5 |
| Tableau | AI-assisted analytics, natural-language queries, automated insights | Analysis, visualization, summaries | Enterprise BI and analytics | 4.4/5 |
| Power BI | AI analytics, Copilot, natural-language querying | Report creation, analysis, summaries | Microsoft-based analytics teams | 4.5/5 |
| Qlik Sense | AI-assisted analytics, natural-language interaction, automated insights | Data exploration, insights, visualization | Governed enterprise analytics | 4.5/5 |
| Domo | AI analytics, natural-language interaction, automated insights | Analysis, reporting, dashboards | Business analytics and reporting | 4.2/5 |
| Hex | AI analysis, SQL generation, natural-language data workflows | Querying, analysis, visualization | Data teams and analysts | 4.5/5 |
| Julius AI | AI data analysis, natural-language interaction, automated analysis | Data analysis, visualization, reporting | Spreadsheet and dataset analysis | 4.5/5 |
| Databricks | AI/ML analytics, natural-language querying, AI-assisted data workflows | Data analysis, SQL, model-assisted analytics | Enterprise data and AI teams | 4.6/5 |
8 Best AI Data Analytics Tools
The following AI data analytics tools combine artificial intelligence with data querying, exploration, visualization, reporting, and insight generation. They serve different audiences, from business users looking for natural-language analytics to professional data teams building advanced analytical workflows.
#1. ThoughtSpot
ThoughtSpot is an AI-powered analytics platform designed to help users explore business data through natural-language questions and search-based analytics. It combines AI-driven data exploration with dashboards, visualizations, and governed analytics, allowing business users to investigate data without depending entirely on manually built reports. Its platform is designed for organizations that want to make analytics accessible across both technical and non-technical teams.
ThoughtSpot’s AI capabilities allow users to ask questions about their data using natural language and receive analytical results without manually constructing complex queries. The platform can interpret business questions, identify relevant data, and generate visual answers that users can explore further. This makes it particularly useful for self-service analytics, where users need to move quickly from a business question to an answer.
The platform also supports conversational exploration and AI-generated insights, allowing users to continue asking questions about the results. Instead of treating each query as an isolated report, users can investigate trends, compare metrics, drill into segments, and explore potential explanations through an interactive workflow. This positions ThoughtSpot as an AI analytics layer between enterprise data and business users.
Key Features
- Natural-Language Analytics: ThoughtSpot allows users to ask questions about business data in everyday language, reducing the need to manually construct analytical queries.
- AI-Powered Search: AI interprets user questions and identifies relevant data and metrics, helping users quickly discover information across connected business datasets.
- AI-Generated Insights: The platform can surface meaningful patterns and insights from data, helping users identify trends or changes that may otherwise require manual exploration.
- Conversational Analytics: Users can ask follow-up questions about analytical results, allowing them to refine an investigation without starting a completely new workflow.
- AI-Assisted Visualization: Natural-language questions can be transformed into visual analytical results, helping users understand patterns and communicate findings.
- Automated Data Exploration: AI can help users explore different dimensions and segments of their data without requiring them to manually build every query or report.
- Enterprise Data Context: AI analytics can operate against governed business data and defined metrics, helping organizations maintain consistency across self-service analysis.
- Embedded AI Analytics: ThoughtSpot can bring AI-powered analytics into applications and business workflows, allowing users to access data insights within the environments where they work.
G2 Rating: 4.5/5
Showcase your software to buyers actively comparing tools. Submit your product for editorial review and get featured on Data Stack Hub.
Submit Your Tool →#2. Tableau
Tableau is a business intelligence and data visualization platform that has incorporated AI capabilities to help users analyze data, generate insights, and interact with analytics using natural language. It combines traditional visual analytics with AI-assisted workflows, making it useful for organizations that need both advanced analytical capabilities and accessible self-service data exploration.
Tableau’s AI capabilities can help users work with data using natural-language questions and automated analytical assistance. Instead of manually creating every visualization or navigating through large datasets, users can use AI to explore information, generate summaries, and investigate business questions. Professional analysts can also use AI assistance to accelerate repetitive analytical and reporting tasks.
The platform fits into a broader enterprise analytics lifecycle that includes data preparation, analysis, visualization, reporting, and sharing. AI can assist at different stages, but users can still inspect the underlying data and visualizations. This combination makes Tableau relevant for organizations that want to introduce AI into existing business intelligence workflows without replacing their established analytics infrastructure.
Key Features
- AI-Assisted Data Analysis: Tableau uses AI capabilities to help users analyze business data and identify useful information without requiring every analytical step to be completed manually.
- Natural-Language Analytics: Users can ask questions about their data using natural language, allowing AI to help translate business questions into analytical queries and visual results.
- AI-Generated Insights: AI can help surface patterns, trends, and notable changes in datasets, giving users additional context during data exploration.
- AI-Assisted Visualization: AI capabilities can support the process of turning analytical questions and data into visual representations that are easier to interpret.
- Automated Data Summaries: AI can summarize analytical findings in natural language, helping users understand important information without manually interpreting every visualization.
- Conversational Data Exploration: Users can continue investigating a dataset through follow-up questions, making analytical workflows more interactive and iterative.
- AI-Assisted Reporting: AI can help accelerate reporting workflows by supporting the creation and interpretation of analytical content for business users.
- Enterprise Analytics Integration: AI capabilities operate within a broader BI environment, allowing organizations to combine AI-assisted analysis with established dashboards, data sources, and governance processes.
G2 Rating: 4.4/5
Also Read: Best Tableau Alternatives and Competitors
#3. Power BI
Power BI is Microsoft’s business intelligence and analytics platform, providing data visualization, reporting, data modeling, and AI-assisted analytics capabilities. It is designed to help organizations connect to data sources, build analytical models, create dashboards, and distribute insights across teams. Its AI capabilities add natural-language interaction and generative AI assistance to established business intelligence workflows.
Power BI’s AI capabilities can help users ask questions about data using natural language and receive analytical answers without manually constructing every query or visualization. AI assistance can also help users summarize reports, identify relevant information, and work with analytical content more efficiently. For professional analysts, AI can reduce repetitive work involved in exploring and documenting data.
The platform is particularly relevant for organizations already using Microsoft’s data ecosystem. AI-assisted analytics can operate alongside Power BI’s data models, reports, dashboards, and business intelligence infrastructure. This allows organizations to introduce generative AI into existing analytics workflows while retaining established data models and governance structures.
Key Features
- Copilot-Assisted Analytics: Power BI’s AI capabilities can help users analyze data, create analytical content, and interact with reports using natural-language instructions.
- Natural-Language Data Questions: Users can ask questions about their business data in natural language and receive AI-assisted analytical responses based on available data models.
- AI-Generated Report Content: AI can assist with creating and summarizing analytical content, reducing repetitive work involved in building and documenting reports.
- Automated Data Summaries: AI can summarize important information from reports and datasets, helping users understand analytical findings more quickly.
- AI-Powered Data Exploration: Users can use natural-language interaction to investigate trends, metrics, and segments instead of manually navigating through every analytical view.
- AI-Assisted Visualization: AI can help users create or work with visual analytical content based on their data and reporting requirements.
- Conversational Analytics: Users can interact with their data and reports through follow-up questions, enabling more iterative exploration of business information.
- Enterprise AI Analytics: Power BI combines AI-assisted analysis with business intelligence models, dashboards, security controls, and Microsoft’s broader data ecosystem.
G2 Rating: 4.5/5
Also Read: Best Power BI Alternatives and Competitors
#4. Qlik Sense
Qlik Sense is an analytics and business intelligence platform that combines data visualization, associative analytics, and AI-assisted data exploration. It is designed to help organizations discover relationships within data and provide self-service analytics to business and technical users. Its AI capabilities extend traditional analytics by helping users interact with data using natural language and generate insights more efficiently.
Qlik’s AI capabilities can help users explore datasets, ask questions, and identify relevant insights without relying entirely on manually constructed analytical queries. AI assistance can interpret natural-language requests and help users navigate data, while automated insight capabilities can surface patterns and relationships that may require significant manual analysis to discover.
The platform is particularly relevant for organizations that need governed analytics across multiple data sources. Its AI capabilities operate alongside data integration, visualization, and analytics workflows, allowing teams to combine automated insight generation with human investigation. This makes Qlik Sense useful for organizations that want AI-assisted analytics while maintaining control over enterprise data and analytical processes.
Key Features
- AI-Assisted Analytics: Qlik Sense uses AI to help users explore datasets, identify relevant information, and accelerate analytical workflows.
- Natural-Language Data Interaction: Users can ask questions about their data in natural language, making analytical exploration more accessible to users who may not know how to construct complex queries.
- Automated Insight Generation: AI can identify notable patterns and relationships in data, helping users discover potential insights without manually examining every available metric.
- AI-Powered Data Exploration: Users can investigate data from different perspectives and use AI assistance to identify relationships between dimensions and measures.
- Conversational Analytics: Natural-language interactions can support follow-up questions and iterative analysis, allowing users to continue exploring a topic without rebuilding the analysis from scratch.
- AI-Assisted Visualization: AI capabilities can support the creation and interpretation of visual analytics so users can better understand patterns in business data.
- Augmented Analytics: AI and machine learning capabilities can supplement traditional analytics by helping users identify patterns, generate insights, and accelerate analysis.
- Governed Enterprise Analytics: AI-assisted workflows can operate within broader enterprise data and governance structures, helping organizations maintain control over analytical data and access.
G2 Rating: 4.5/5
Also Read: Best Qlik Sense Alternatives and Competitors
#5. Domo
Domo is a cloud-based business intelligence and data analytics platform that combines data integration, dashboards, visualization, and AI-powered analytics. It is designed to help organizations bring data from different sources into a shared analytics environment and make that information accessible to business teams. Its AI capabilities add natural-language interaction, automated analysis, and AI-assisted insight generation to the broader BI workflow.
Domo’s AI capabilities can help users explore data and ask questions without manually building every query or dashboard. Natural-language interaction can make it easier for users to investigate business metrics, while AI-assisted analysis can help identify patterns and summarize information. This reduces the amount of manual work required to turn raw business data into understandable analytical outputs.
The platform also supports broader enterprise analytics workflows, allowing AI-assisted analysis to work alongside dashboards, data pipelines, and business reporting. This makes Domo relevant for organizations that need a centralized analytics environment where AI can assist with data exploration and reporting while business teams continue using structured dashboards and governed data.
Key Features
- AI-Powered Data Analysis: Domo uses AI capabilities to help users explore business data, identify relevant information, and accelerate common analytical workflows.
- Natural-Language Analytics: Users can ask questions about their data using natural language, allowing AI to help translate business questions into analytical requests.
- Automated Insights: AI can help surface important patterns and changes in business data so users can focus attention on potentially meaningful findings.
- AI Data Summaries: Analytical information can be summarized using AI, making large datasets and business reports easier to understand.
- Conversational Data Exploration: Users can interact with data through follow-up questions, allowing them to investigate business topics iteratively rather than creating separate reports for every question.
- AI-Assisted Reporting: AI can support reporting workflows by helping users interpret analytical information and produce more accessible summaries.
- AI-Powered Visualization: AI-assisted analytics can help users move from data toward visual representations that make patterns and trends easier to identify.
- Enterprise Data Integration: Domo connects AI-assisted analytics with broader data integration and business intelligence workflows, allowing organizations to analyze information from multiple sources.
G2 Rating: 4.2/5
Also Read: Best Domo Alternatives and Competitors
Increase your product visibility by reaching software buyers researching the best tools. Every submission is reviewed by our editorial team.
Feature My Tool →#6. Hex
Hex is an AI-powered data analytics workspace that combines SQL, notebooks, visualization, and natural-language data analysis. It is designed for data analysts, analytics engineers, and data teams that need to explore datasets and build analytical workflows while retaining access to code and SQL. Its AI capabilities help users move from analytical questions to queries, analysis, and visual results more efficiently.
Hex uses AI to help generate SQL and analytical code from natural-language requests. Users can describe the question they want to answer and use AI assistance to create the analytical steps needed to investigate the data. This can reduce repetitive coding while allowing professional analysts to inspect, modify, and extend the generated work.
The platform is particularly useful for teams that need both AI-assisted analysis and technical control. Analysts can combine natural-language interaction with SQL, Python, visualizations, and other analytical components, allowing AI to accelerate parts of the workflow without hiding the underlying analytical process. This makes Hex relevant for more advanced data teams that want generative AI integrated into their existing analytical work.
Key Features
- AI SQL Generation: Hex can generate SQL from natural-language analytical requests, helping data teams move from a business question to an executable query more quickly.
- AI-Assisted Data Analysis: AI can support analytical workflows by helping users investigate datasets, generate analytical steps, and interpret results.
- Natural-Language Data Exploration: Users can describe analytical questions in plain language and use AI assistance to explore the underlying data.
- AI Code Generation: AI can help generate code for analytical workflows, reducing repetitive programming work while allowing analysts to review and modify the resulting code.
- AI-Assisted Visualization: AI capabilities can help users move from analytical questions and queried data toward visual outputs that communicate patterns and findings.
- Conversational Analysis: Users can iteratively refine analytical questions through natural-language interactions, making it easier to investigate follow-up questions.
- AI-Powered Data Summaries: AI can help summarize analytical results and explain important findings in natural language.
- Integrated Technical Analytics: AI operates alongside SQL, Python, notebooks, and visualization capabilities, allowing professional data teams to combine AI assistance with their existing analytical methods.
G2 Rating: 4.5/5
#7. Julius AI
Julius AI is an AI-powered data analysis tool designed to let users analyze datasets using natural-language instructions. It can work with common data formats and allows users to ask questions about their data without manually writing SQL or statistical code for every analytical task. This makes it particularly useful for business users, analysts, researchers, and other users who need to extract insights from structured datasets.
Julius AI uses generative AI to interpret analytical questions and perform data-analysis tasks. Users can upload or connect data and ask questions about trends, relationships, calculations, or patterns in natural language. The AI can then determine the appropriate analytical approach and generate the necessary code or analysis behind the scenes.
The platform also supports visualization and reporting workflows, allowing users to move from a question to an analytical result and then communicate the findings. This makes Julius AI useful for exploratory analysis where users want to investigate a dataset quickly without manually building every query, statistical calculation, or visualization.
Key Features
- Natural-Language Data Analysis: Julius AI allows users to describe analytical questions in everyday language and uses AI to determine how the dataset should be analyzed.
- AI-Powered Dataset Exploration: Users can ask questions about uploaded or connected datasets and use AI assistance to identify patterns, relationships, and notable values.
- Automated Analytical Code: AI can generate the code required to perform analytical operations, reducing the need for users to manually write Python or other analysis code.
- AI Data Visualization: Julius AI can generate charts and other visual representations based on analytical requests, helping users understand and communicate patterns in their data.
- AI Statistical Analysis: The platform can assist with statistical calculations and analysis based on natural-language requirements, making advanced analytical workflows more accessible.
- Conversational Data Analysis: Users can ask follow-up questions about an analysis and continue investigating the same dataset through an iterative AI workflow.
- Automated Data Insights: AI can help identify trends, relationships, and other findings in datasets that users may want to investigate further.
- AI-Assisted Reporting: Analytical findings can be transformed into understandable summaries and visual outputs, helping users communicate results without manually preparing every component.
G2 Rating: 4.5/5
#8. Databricks
Databricks is a unified data and AI platform that combines data engineering, analytics, machine learning, and artificial intelligence capabilities. It provides an environment where organizations can store, process, query, analyze, and model large-scale data while using AI across different stages of the data lifecycle. Its analytics capabilities are particularly relevant for enterprise data teams working with large and complex datasets.
Databricks uses AI to support natural-language data interaction, SQL development, analytics, and machine learning workflows. Users can use AI assistance to generate SQL, understand data, explore datasets, and accelerate analytical development. Because these capabilities operate within a broader data platform, AI-assisted analytics can work alongside data engineering pipelines, governed datasets, and machine learning workloads.
The platform is designed for more advanced data and AI environments where analytics is connected to the broader lifecycle of enterprise data. Data teams can use AI to accelerate query development and analysis while continuing to work with structured data, machine learning models, notebooks, and data engineering workflows. This makes Databricks particularly relevant to organizations building integrated data and AI platforms rather than standalone analytics solutions.
Key Features
- AI-Assisted SQL: Databricks provides AI assistance for generating and working with SQL, helping data professionals create queries and modify analytical logic more efficiently.
- Natural-Language Data Interaction: Users can interact with data and analytical environments using natural-language requests, reducing the need to manually construct every analytical query.
- AI Data Analysis: AI capabilities can help teams explore datasets, investigate analytical questions, and accelerate the process of turning enterprise data into insights.
- AI Code Generation: Data professionals can use AI assistance to generate or modify analytical code, reducing repetitive development work across data and analytics projects.
- AI-Powered Data Exploration: AI can assist users in understanding datasets and investigating analytical questions within the broader Databricks data environment.
- Conversational Analytics: Natural-language interaction allows users to refine analytical questions and continue exploring data through iterative AI-assisted workflows.
- Machine Learning Integration: AI analytics can operate alongside machine learning development and data engineering workflows, connecting analytical work with broader AI development processes.
- Enterprise Data and AI Platform: Databricks integrates AI-assisted analytics with data processing, governance, engineering, SQL, notebooks, and machine learning capabilities for large-scale data environments.
G2 Rating: 4.6/5
Also Read: Best Databricks Alternatives and Competitors
How to Choose the Right AI Data Analytics Tool
Choosing an AI data analytics tool depends on your data sources, analytics requirements, technical expertise, and how much of the analysis you want AI to automate.
- AI Analytics Capabilities: Check whether the tool supports the AI workflows you actually need, such as natural-language analysis, automated insights, SQL generation, visualization, or AI-generated summaries.
- Natural-Language Querying: If business users will use the platform, prioritize tools that can understand natural-language questions and translate them into useful analytical results.
- Data Source Support: Make sure the tool can connect to the databases, warehouses, spreadsheets, files, and other data sources your team already uses.
- AI Insight Generation: Look for AI capabilities that can identify trends, anomalies, relationships, and other notable patterns rather than simply generating charts from predefined queries.
- Visualization: Evaluate whether AI can help create appropriate charts and visualizations based on the analytical question instead of requiring users to manually configure every visualization.
- AI Code and SQL Generation: For data analysts and technical teams, check whether the platform can generate or modify SQL, Python, or other analytical code to accelerate more complex workflows.
- Conversational Analytics: Consider whether users can ask follow-up questions and continue investigating the same dataset or analytical result through an AI conversation.
- Data Accuracy and Context: AI-generated insights should be based on reliable data and the correct business definitions. Check how the platform handles data models, metrics, semantic context, and validation.
- Security and Governance: For enterprise analytics, evaluate permissions, sensitive-data handling, governance, access controls, and how AI interacts with connected business data.
- Integration With Your Data Stack: Check whether the platform fits with your existing BI, data warehouse, database, analytics, and reporting workflows rather than creating an isolated AI analytics environment.
Browse expertly curated software recommendations across hundreds of business categories.
Browse Top Tools →Conclusion
AI data analytics tools are making data analysis more accessible while helping experienced analysts automate repetitive parts of their workflows. Natural-language querying, AI-generated SQL, automated insights, visualization, data summaries, and conversational analysis can significantly reduce the manual work involved in moving from a business question to an analytical result.
The tools covered in this article take different approaches to AI-powered analytics. ThoughtSpot, Tableau, Power BI, Qlik Sense, and Domo combine AI with broader business intelligence and self-service analytics capabilities. They are designed to help business users and analysts explore enterprise data, generate insights, and work with dashboards and reports more efficiently.
Hex and Julius AI take a more analysis-focused approach. Hex combines AI with SQL, Python, notebooks, and visualization for technical data teams, while Julius AI focuses on natural-language analysis of datasets and automated analytical workflows. Databricks operates at a broader enterprise data and AI layer, connecting AI-assisted analytics with data engineering, SQL, machine learning, and large-scale data workflows.
The right platform depends on the type of analysis your team performs. Business users may prioritize natural-language interaction and automated insights, while professional analysts may need AI-generated SQL, Python, statistical analysis, and greater control over the underlying analytical process.
AI should also support—not replace—analytical validation. An AI-generated insight can be based on an incorrect metric, incomplete dataset, inappropriate calculation, or misleading correlation. Teams should therefore validate important findings against the underlying data and business context before using them for significant decisions.
For organizations adopting AI analytics at scale, data quality, governance, security, and semantic context are just as important as the AI capabilities themselves. A powerful AI model cannot produce reliable analytics from poorly defined metrics or inaccurate source data.
Frequently Asked Questions
1. What are AI data analytics tools?
AI data analytics tools use artificial intelligence to help users query, analyze, visualize, and interpret data. They can support natural-language analysis, SQL generation, automated insights, anomaly detection, data visualization, and AI-generated summaries.
2. How do AI data analytics tools work?
AI analytics tools typically combine AI models with structured datasets, databases, semantic models, or business intelligence systems. The AI interprets a user’s analytical request and can generate queries, perform analysis, create visualizations, or explain the resulting data.
3. Can AI data analytics tools analyze data automatically?
Yes. Depending on the platform, AI can automate parts of data exploration, statistical analysis, pattern detection, visualization, summarization, and insight generation.
4. Can AI data analytics tools generate SQL?
Yes. Many AI analytics platforms can translate natural-language questions into SQL. This allows users to ask questions about business data without manually writing the underlying database query.
5. Can AI data analytics tools create visualizations?
Yes. AI can generate or recommend visualizations based on the dataset and analytical question. Some platforms can automatically select charts or create visual outputs from natural-language instructions.
6. Can AI analytics tools detect trends and anomalies?
Yes. AI can analyze data patterns and identify unusual changes, trends, relationships, or outliers. The specific anomaly detection and automated insight capabilities vary between platforms.
7. Can non-technical users use AI data analytics tools?
Yes. Natural-language analytics allows users to ask questions about business data without necessarily knowing SQL, Python, or advanced analytics techniques. However, users should still understand the business context and validate important results.
8. Can AI data analytics tools replace data analysts?
AI can automate repetitive analytical tasks, but it does not eliminate the need for data analysts. Analysts are still important for defining metrics, validating results, understanding business context, investigating ambiguous findings, and communicating meaningful conclusions.
9. Are AI-generated data insights accurate?
AI-generated insights should be validated before being treated as authoritative. AI can produce an incorrect calculation, misunderstand a business metric, overlook data-quality issues, or interpret a correlation incorrectly.
10. What is the difference between AI data analytics tools and AI BI tools?
AI data analytics tools focus on using AI to analyze and interpret data, while AI BI tools generally combine AI with broader business intelligence capabilities such as dashboards, reporting, visualization, data modeling, and enterprise analytics.
11. Can AI data analytics tools work with large datasets?
Yes. Enterprise platforms such as Databricks, Power BI, Tableau, and other analytics systems can work with large datasets and data warehouse environments. The actual scale and performance depend on the platform, architecture, and underlying data infrastructure.
12. What are the best AI data analytics tools in 2026?
The tools covered in this article are ThoughtSpot, Tableau, Power BI, Qlik Sense, Domo, Hex, Julius AI, and Databricks. They cover different AI analytics use cases, including natural-language analysis, automated insights, visualization, SQL generation, data exploration, and enterprise data analytics.
13. What are AI-powered data analysis tools?
AI-powered data analysis tools use generative AI, machine learning, or other AI techniques to automate or assist with data-analysis tasks. They can help users explore datasets, generate analytical code, identify patterns, create visualizations, and explain findings.
14. Can AI data analytics tools analyze Excel and CSV files?
Yes. Some AI analytics platforms allow users to upload spreadsheets and CSV files and then ask questions about the data using natural language. The AI can perform calculations, identify patterns, and generate visualizations depending on the tool’s capabilities.
15. What are AI data analytics tools used for?
AI data analytics tools are used for data exploration, natural-language querying, SQL generation, automated insights, trend analysis, anomaly detection, visualization, reporting, statistical analysis, and conversational data analysis.