
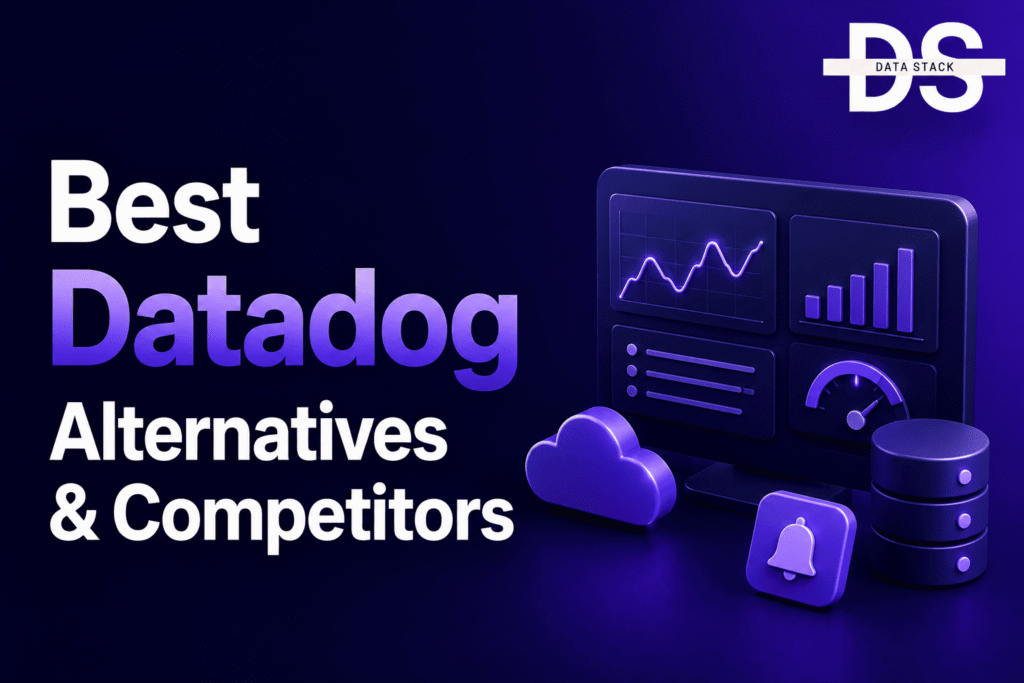
Datadog is one of the most widely adopted observability platforms for monitoring cloud infrastructure, applications, logs, containers, Kubernetes, and security events from a single dashboard. Its broad feature set and extensive integrations have made it a popular choice for DevOps, SRE, platform engineering, and cloud operations teams.
Despite its popularity, many organizations start looking for Datadog alternatives as their environments grow. Rising costs, usage-based pricing, complex licensing, data retention limits, and the need for self-hosted deployments are some of the most common reasons businesses evaluate other observability platforms. Some teams also prefer specialized solutions that provide stronger application performance monitoring (APM), log analytics, infrastructure monitoring, or open-source observability.
Fortunately, there are several excellent Datadog competitors available today. Some platforms offer complete observability suites, while others focus on metrics, distributed tracing, log management, or Kubernetes monitoring. Whether you’re looking for a lower-cost Datadog replacement, an enterprise monitoring platform, or an open-source alternative, this guide compares the leading options to help you choose the right solution.
Table of Contents
ToggleWhat is Datadog?
Datadog is a cloud-native observability platform that helps organizations monitor infrastructure, applications, logs, networks, containers, cloud services, and security events from a unified dashboard. It enables DevOps, SRE, platform engineering, and IT operations teams to collect metrics, traces, and logs in real time, making it easier to detect performance issues, troubleshoot incidents, and optimize system reliability.
The platform integrates with hundreds of cloud services, operating systems, databases, Kubernetes environments, CI/CD tools, and third-party applications, making it one of the most comprehensive monitoring solutions available. Along with infrastructure monitoring, Datadog offers application performance monitoring (APM), log management, real user monitoring (RUM), synthetic monitoring, cloud security, network monitoring, and incident management.
While Datadog delivers a broad feature set, many organizations eventually explore Datadog alternatives as monitoring costs increase or when they require open-source solutions, self-hosted deployments, or specialized observability platforms.
Why Look for Datadog Alternatives?
Organizations evaluate Datadog competitors for several practical reasons as their infrastructure and observability requirements evolve.
- Usage-based pricing becomes expensive. Monitoring costs often increase significantly as infrastructure, logs, metrics, traces, and users grow.
- You need a self-hosted solution. Some organizations require complete control over monitoring infrastructure for compliance, security, or internal governance.
- Open-source observability is a priority. Engineering teams frequently evaluate open-source alternatives that offer greater flexibility and lower licensing costs.
- Your monitoring requirements have become more specialized. Some businesses prioritize application performance monitoring, while others focus on log analytics, Kubernetes observability, cloud monitoring, or network performance.
- You want simpler licensing. Predictable pricing models are often easier to manage than consumption-based billing.
- You’re consolidating your monitoring stack. Many organizations look for platforms that combine infrastructure monitoring, APM, logging, security monitoring, and incident response into a single solution.
Comparison Table: Best Datadog Alternatives
| Tool | G2 Rating | Best For | Deployment | Free Plan | Starting Price |
|---|---|---|---|---|---|
| New Relic | 4.3/5 | Full-stack observability | Cloud | Yes | Free & Paid |
| Dynatrace | 4.5/5 | Enterprise observability | Cloud | Trial | Custom |
| Grafana Cloud | 4.5/5 | Open observability | Cloud / Self-hosted | Yes | Free & Paid |
| Splunk Observability Cloud | 4.1/5 | Enterprise monitoring | Cloud | Trial | Custom |
| Elastic Observability | 4.4/5 | Log analytics | Cloud / Self-hosted | Yes | Free & Paid |
| LogicMonitor | 4.5/5 | Hybrid infrastructure monitoring | Cloud | Trial | Custom |
| AppDynamics | 4.3/5 | Application performance monitoring | Cloud / On-premises | Trial | Custom |
| Sumo Logic | 4.3/5 | Cloud-native monitoring | Cloud | Trial | Custom |
| Prometheus | 4.7/5 | Open-source metrics monitoring | Self-hosted | Yes | Free |
| Zabbix | 4.4/5 | Open-source infrastructure monitoring | Self-hosted | Yes | Free |
G2 ratings and pricing are subject to change.
10 Best Datadog Alternatives and Competitors
#1 New Relic
New Relic is one of the closest Datadog alternatives for organizations looking for a complete observability platform. It combines infrastructure monitoring, application performance monitoring (APM), distributed tracing, log management, browser monitoring, synthetic monitoring, and real user monitoring (RUM) into a unified platform. Because of its broad capabilities, New Relic is often shortlisted alongside Datadog during enterprise monitoring evaluations.
Compared with Datadog, New Relic places a strong emphasis on developer experience and application observability. Engineering teams can correlate infrastructure metrics, application traces, logs, and user experience data from a single interface, making it easier to identify performance bottlenecks across distributed systems.
The platform integrates with major cloud providers, Kubernetes, containers, databases, CI/CD platforms, and hundreds of third-party services, making it suitable for organizations operating modern cloud-native environments.
Key Features
- Full-stack observability covering infrastructure, APM, logs, traces, and user experience.
- Distributed tracing for microservices and cloud-native applications.
- Real user monitoring (RUM) and synthetic monitoring.
- Kubernetes and container monitoring with deep performance insights.
- AI-assisted alerting and incident detection.
- Extensive integrations with cloud platforms, databases, DevOps tools, and SaaS applications.
Limitations
- Advanced features can become expensive as data ingestion increases.
- Initial configuration requires planning for larger environments.
- Some dashboards and workflows have a learning curve for new users.
Pricing
New Relic offers a generous free tier along with usage-based paid plans that scale according to data ingestion and platform usage.
Why Choose It
Choose New Relic if you need an enterprise-grade observability platform that delivers deep application performance monitoring alongside infrastructure, logs, and distributed tracing within a single interface.
G2 Rating: 4.3/5
Deployment: Cloud
Free Plan: Yes
Best For: Full-stack observability, APM, and cloud-native application monitoring.
#2 Dynatrace
Dynatrace is one of the leading Datadog competitors for large enterprises that require AI-powered observability, automated root cause analysis, and end-to-end visibility across complex hybrid and multi-cloud environments. Unlike Datadog, which relies heavily on manual dashboard creation and alert tuning, Dynatrace uses its Davis AI engine to automatically detect anomalies, correlate dependencies, and identify the root cause of performance issues.
The platform provides deep visibility into infrastructure, applications, Kubernetes clusters, cloud services, databases, user experience, and security. Its automatic service discovery and topology mapping eliminate much of the manual configuration typically associated with enterprise monitoring platforms.
Dynatrace is particularly well suited for organizations managing large-scale cloud-native applications where minimizing downtime and accelerating incident response are business-critical priorities.
Key Features
- Full-stack observability across infrastructure, applications, logs, networks, and cloud services.
- AI-powered root cause analysis using Davis AI.
- Automatic service discovery and dependency mapping.
- Deep Kubernetes, container, and microservices monitoring.
- Digital experience monitoring, real user monitoring, and synthetic monitoring.
- Integrated application security and cloud automation capabilities.
Limitations
- Premium pricing compared to many Datadog alternatives.
- Feature-rich interface can require time to master.
- Better suited for medium and large enterprises than smaller teams.
Pricing
Dynatrace offers custom pricing based on monitored hosts, applications, and observability modules. A free trial is available.
Why Choose It
Choose Dynatrace if you need enterprise-grade observability with AI-driven automation, intelligent root cause analysis, and comprehensive monitoring across hybrid and multi-cloud environments.
G2 Rating: 4.5/5
Deployment: Cloud
Free Plan: Trial Available
Best For: Enterprise observability, AIOps, and hybrid cloud monitoring.
Showcase your software to buyers actively comparing tools. Submit your product for editorial review and get featured on Data Stack Hub.
Submit Your Tool →#3 Grafana Cloud
Grafana Cloud is one of the best open-source Datadog alternatives for organizations that want flexible observability without vendor lock-in. Built on open technologies such as Grafana, Prometheus, Loki, Tempo, and Mimir, it provides a unified platform for metrics, logs, traces, and dashboards while supporting both managed cloud and self-hosted deployments.
Unlike Datadog, Grafana Cloud embraces an open observability approach that allows teams to collect telemetry from virtually any source while maintaining greater control over storage, visualization, and monitoring architecture. This flexibility has made Grafana a favorite among DevOps teams, Kubernetes administrators, and platform engineers.
Organizations already using Prometheus or OpenTelemetry can integrate Grafana Cloud with minimal changes, making migration relatively straightforward.
Key Features
- Unified monitoring for metrics, logs, traces, and dashboards.
- Native support for Prometheus, Loki, Tempo, OpenTelemetry, and Kubernetes.
- Highly customizable dashboards and alerting.
- Extensive integrations with cloud providers, databases, and DevOps tools.
- Available as both managed cloud and self-hosted deployments.
- Strong open-source ecosystem and community support.
Limitations
- Initial configuration may require more technical expertise than Datadog.
- Advanced enterprise features require paid plans.
- Large environments require proper dashboard and alert management.
Pricing
Grafana Cloud offers a free plan alongside usage-based paid tiers for larger deployments.
Why Choose It
Choose Grafana Cloud if you want an open, highly customizable observability platform that integrates seamlessly with Prometheus, Kubernetes, and OpenTelemetry while reducing vendor lock-in.
G2 Rating: 4.5/5
Deployment: Cloud and Self-hosted
Free Plan: Yes
Best For: Open-source observability, Kubernetes monitoring, and custom dashboards.
#4 Splunk Observability Cloud
Splunk Observability Cloud is an enterprise observability platform that combines infrastructure monitoring, APM, log analysis, real user monitoring, synthetic monitoring, and distributed tracing into a single solution. It is designed for organizations operating large-scale cloud environments that require high-performance monitoring and rapid incident response.
Compared with Datadog, Splunk places greater emphasis on enterprise analytics and operational intelligence. Its real-time analytics engine helps organizations process massive volumes of telemetry data while delivering actionable insights for DevOps, SRE, and IT operations teams.
The platform integrates closely with the broader Splunk ecosystem, making it a strong choice for enterprises already using Splunk for SIEM or log management.
Key Features
- Infrastructure monitoring, APM, logs, traces, and user experience monitoring.
- High-speed analytics for large telemetry datasets.
- AI-assisted anomaly detection and alerting.
- Deep Kubernetes and cloud-native monitoring.
- OpenTelemetry support for telemetry collection.
- Native integration with Splunk Enterprise and Splunk Cloud.
Limitations
- Higher pricing than many competing platforms.
- Best value is achieved within the Splunk ecosystem.
- Advanced configuration may require specialized expertise.
Pricing
Splunk Observability Cloud offers custom enterprise pricing with a free trial available.
Why Choose It
Choose Splunk Observability Cloud if your organization already uses Splunk products and requires enterprise-scale observability with advanced analytics and operational intelligence.
G2 Rating: 4.1/5
Deployment: Cloud
Free Plan: Trial Available
Best For: Enterprise observability and large-scale cloud monitoring.
#5 Elastic Observability
Elastic Observability extends the Elastic Stack by bringing together infrastructure monitoring, application performance monitoring, log analytics, distributed tracing, and uptime monitoring within a single platform. It is widely adopted by organizations that already use Elasticsearch and Kibana for search and log management.
One of Elastic Observability’s biggest strengths is flexibility. Organizations can deploy it as a managed cloud service or self-host it, making it a practical Datadog replacement for businesses that need greater control over infrastructure and data retention. Its support for OpenTelemetry and extensive integration ecosystem also simplifies monitoring across modern cloud-native environments.
Because it combines powerful search capabilities with observability, Elastic is especially attractive for teams handling large volumes of log data.
Key Features
- Unified platform for logs, metrics, traces, and uptime monitoring.
- Built on Elasticsearch and Kibana.
- Native OpenTelemetry support.
- Cloud and self-managed deployment options.
- Advanced search, visualization, and analytics capabilities.
- Strong Kubernetes and container monitoring support.
Limitations
- Requires operational expertise for self-managed deployments.
- Advanced tuning may be necessary for large environments.
- Learning curve can be higher than fully managed SaaS platforms.
Pricing
Elastic Observability offers free and paid editions with pricing varying by deployment model and resource consumption.
Why Choose It
Choose Elastic Observability if you need a powerful, flexible observability platform with industry-leading log analytics and the option to self-host your monitoring infrastructure.
G2 Rating: 4.4/5
Deployment: Cloud and Self-hosted
Free Plan: Yes
Best For: Log analytics, observability, and Elasticsearch-based monitoring.
#6 LogicMonitor
LogicMonitor is a SaaS-based infrastructure monitoring platform designed for organizations managing hybrid IT environments across on-premises infrastructure, cloud services, networks, servers, and applications. Unlike Datadog, which primarily targets cloud-native observability, LogicMonitor provides extensive coverage for businesses operating a combination of legacy infrastructure and modern cloud platforms.
The platform automatically discovers devices, monitors performance, and generates intelligent alerts without requiring extensive manual configuration. Its broad device support and predictive monitoring capabilities make it a popular choice for IT operations teams responsible for maintaining large enterprise environments.
LogicMonitor also integrates with leading cloud providers including AWS, Microsoft Azure, and Google Cloud, allowing organizations to monitor hybrid infrastructure from a single platform.
Key Features
- Infrastructure monitoring for servers, networks, storage, databases, and cloud services.
- Automatic device discovery and dependency mapping.
- Intelligent alerting with anomaly detection.
- Hybrid cloud monitoring across AWS, Azure, Google Cloud, and on-premises environments.
- Custom dashboards and reporting.
- Extensive library of pre-built monitoring integrations.
Limitations
- Less comprehensive application observability than Datadog.
- Pricing may be high for smaller organizations.
- Advanced customization requires additional configuration.
Pricing
LogicMonitor offers custom pricing based on monitored resources and deployment size.
Why Choose It
Choose LogicMonitor if your organization manages hybrid infrastructure and needs a platform that delivers deep visibility across on-premises systems and cloud environments from a single dashboard.
G2 Rating: 4.5/5
Deployment: Cloud
Free Plan: Trial Available
Best For: Hybrid infrastructure monitoring and IT operations.
Increase your product visibility by reaching software buyers researching the best tools. Every submission is reviewed by our editorial team.
Feature My Tool →#7 AppDynamics
AppDynamics, now part of Cisco, is an enterprise application performance monitoring (APM) platform that helps organizations monitor application health, business transactions, infrastructure, and user experience in real time. It is one of the strongest Datadog alternatives for businesses where application performance directly impacts customer experience and revenue.
Unlike Datadog, which provides a broad observability platform, AppDynamics focuses heavily on application intelligence. It tracks transactions across distributed applications, databases, APIs, and microservices while automatically identifying performance bottlenecks and business impact.
The platform is widely adopted in banking, retail, telecommunications, and other industries running mission-critical applications that require proactive performance monitoring.
Key Features
- End-to-end application performance monitoring.
- Business transaction monitoring with root cause analysis.
- Infrastructure, database, and cloud monitoring.
- Real user monitoring and synthetic monitoring.
- AI-assisted anomaly detection and performance analytics.
- Integration with Cisco observability and security products.
Limitations
- Enterprise-focused pricing.
- More complex implementation than lightweight monitoring tools.
- Better suited for application monitoring than general infrastructure observability.
Pricing
AppDynamics provides custom enterprise pricing based on deployment requirements.
Why Choose It
Choose AppDynamics if application performance monitoring is your primary priority and you need deep visibility into business transactions across complex enterprise applications.
G2 Rating: 4.3/5
Deployment: Cloud and On-premises
Free Plan: Trial Available
Best For: Enterprise APM and business transaction monitoring.
#8 Sumo Logic
Sumo Logic is a cloud-native observability platform that combines log management, infrastructure monitoring, application monitoring, security analytics, and cloud SIEM capabilities. It is designed for organizations that want to monitor both operational performance and security events from a unified platform.
Compared with Datadog, Sumo Logic places greater emphasis on log analytics and security monitoring while still providing strong infrastructure and application observability. Its cloud-native architecture enables organizations to analyze telemetry data at scale without managing the underlying infrastructure.
The platform is particularly popular among organizations that want to consolidate observability and security operations into a single solution.
Key Features
- Centralized log management and analytics.
- Infrastructure monitoring and application performance monitoring.
- Cloud SIEM and security analytics.
- Kubernetes and container monitoring.
- Machine learning-powered anomaly detection.
- Integrations with leading cloud providers and DevOps tools.
Limitations
- Advanced analytics require time to master.
- Pricing increases with higher data ingestion.
- Smaller observability ecosystem than some competitors.
Pricing
Sumo Logic offers usage-based pricing along with a free trial.
Why Choose It
Choose Sumo Logic if you want to combine observability and security analytics while maintaining centralized visibility across cloud infrastructure and applications.
G2 Rating: 4.3/5
Deployment: Cloud
Free Plan: Trial Available
Best For: Cloud observability, log analytics, and security monitoring.
#9 Prometheus
Prometheus is one of the most widely adopted open-source monitoring systems for collecting and storing time-series metrics. Originally developed at SoundCloud and now a graduated Cloud Native Computing Foundation (CNCF) project, it has become the monitoring standard for Kubernetes and cloud-native environments.
Unlike Datadog, Prometheus focuses specifically on metrics collection and alerting rather than providing a complete observability suite. It integrates seamlessly with Grafana for visualization and Alertmanager for notifications, allowing engineering teams to build highly customized monitoring platforms using open-source technologies.
Organizations seeking a free Datadog alternative often choose Prometheus because of its flexibility, scalability, and strong Kubernetes ecosystem.
Key Features
- Open-source metrics collection and monitoring.
- Native Kubernetes integration.
- Powerful PromQL query language.
- Flexible alerting through Alertmanager.
- Large exporter ecosystem for infrastructure and applications.
- Integrates with Grafana for dashboards and visualization.
Limitations
- Focused primarily on metrics rather than full observability.
- Requires additional tools for logs and distributed tracing.
- Self-hosted deployment requires operational management.
Pricing
Prometheus is completely free and open source.
Why Choose It
Choose Prometheus if you’re building an open-source observability stack focused on metrics monitoring for Kubernetes and cloud-native infrastructure.
G2 Rating: 4.7/5
Deployment: Self-hosted
Free Plan: Yes
Best For: Open-source metrics monitoring and Kubernetes observability.
#10 Zabbix
Zabbix is an enterprise-grade open-source monitoring platform used to monitor servers, virtual machines, networks, databases, cloud environments, and applications. It is a popular Datadog alternative for organizations that require complete control over their monitoring infrastructure without recurring licensing costs.
Unlike Datadog’s SaaS model, Zabbix is self-hosted and highly customizable. It supports agent-based and agentless monitoring, automatic discovery, customizable dashboards, alerting, and extensive integrations through templates and APIs. This flexibility has made it a long-standing choice for enterprises, government agencies, educational institutions, and managed service providers.
For organizations prioritizing cost efficiency and infrastructure ownership, Zabbix remains one of the strongest open-source monitoring solutions available.
Key Features
- Open-source infrastructure and network monitoring.
- Agent-based and agentless monitoring.
- Automatic discovery of devices and services.
- Custom dashboards, reports, and alerting.
- Extensive template library for monitoring common technologies.
- Highly customizable through APIs and integrations.
Limitations
- Self-hosted deployment requires infrastructure management.
- Interface feels less modern than some SaaS competitors.
- Initial configuration can take time for large environments.
Pricing
Zabbix is free and open source. Paid professional support and consulting services are available.
Why Choose It
Choose Zabbix if you need a self-hosted, enterprise-grade monitoring platform without ongoing software licensing costs.
G2 Rating: 4.4/5
Deployment: Self-hosted
Free Plan: Yes
Best For: Open-source infrastructure and network monitoring.
How to Choose Datadog Alternatives
- Monitoring Requirements
Start by identifying what you need to monitor. Some platforms specialize in infrastructure monitoring, while others provide stronger capabilities for application performance monitoring (APM), log management, distributed tracing, Kubernetes observability, or cloud security. Selecting a platform that aligns with your primary monitoring requirements helps avoid paying for features you won’t use.
- Deployment Model
Consider whether a fully managed SaaS platform is sufficient or if your organization requires a self-hosted solution for compliance, security, or data sovereignty. Open-source platforms such as Prometheus and Zabbix provide greater deployment flexibility, whereas cloud-native services simplify operations by eliminating infrastructure management.
- Integration Ecosystem
Your monitoring platform should integrate with the technologies already running in your environment, including cloud providers, Kubernetes, databases, containers, CI/CD pipelines, collaboration tools, and incident management platforms. Broad integration support reduces deployment time and improves visibility across your infrastructure.
- Scalability
As your infrastructure grows, the platform should continue to handle increasing volumes of metrics, logs, traces, and alerts without affecting performance. Enterprise features such as automated discovery, intelligent alerting, distributed tracing, and centralized management become increasingly important in large environments.
- Pricing Structure
Monitoring costs can increase quickly as data volumes expand. Compare pricing models carefully, including charges for hosts, metrics, logs, traces, synthetic monitoring, data retention, and additional users. Understanding the total cost of ownership will help prevent unexpected expenses as your observability environment scales.
- Ease of Management
Some observability platforms require significant operational expertise, while others offer automated discovery, pre-built dashboards, AI-assisted alerting, and simplified administration. Consider how much ongoing maintenance your team is prepared to manage before selecting a platform.
- Support and Community
Evaluate the quality of vendor support, documentation, community resources, and product maturity. Open-source solutions often have active communities, while commercial platforms typically provide enterprise support, SLAs, and dedicated customer success teams.
Compare more software alternatives and discover the right solution for your business.
Browse Alternatives →Conclusion
Datadog remains one of the leading observability platforms for cloud infrastructure and application monitoring, but it isn’t the only option available. Depending on your requirements, you may prioritize lower costs, open-source flexibility, enterprise automation, or specialized monitoring capabilities.
If you’re looking for a full-stack observability platform, New Relic and Dynatrace are among the strongest alternatives. Organizations that prefer open observability should consider Grafana Cloud, Prometheus, or Elastic Observability, while enterprises managing hybrid environments may benefit from LogicMonitor. AppDynamics excels in application performance monitoring, Splunk Observability Cloud is well suited for large enterprise environments, Sumo Logic combines observability with security analytics, and Zabbix remains one of the best self-hosted open-source monitoring platforms.
The best Datadog alternative ultimately depends on your infrastructure, deployment preferences, monitoring priorities, and budget. Evaluating monitoring capabilities, integrations, scalability, pricing, and operational complexity will help you choose a platform that supports both your current environment and future growth.
Frequently Asked Questions
1. What is the best Datadog alternative?
The best Datadog alternative depends on your requirements. New Relic and Dynatrace are excellent enterprise observability platforms, Grafana Cloud is ideal for open observability, and Prometheus is one of the best open-source monitoring solutions for Kubernetes environments.
2. Is there a free alternative to Datadog?
Yes. Prometheus, Grafana Cloud (Free plan), Elastic Observability (Free tier), and Zabbix all provide free options for monitoring infrastructure and applications. They are commonly used by organizations looking to reduce observability costs.
3. Which Datadog alternative is best for Kubernetes monitoring?
Grafana Cloud, Prometheus, Dynatrace, and New Relic all provide strong Kubernetes monitoring capabilities, including metrics collection, distributed tracing, container visibility, and cluster health monitoring.
4. Which Datadog competitor is best for enterprise observability?
Dynatrace, New Relic, Splunk Observability Cloud, and AppDynamics are among the leading enterprise observability platforms, offering AI-powered analytics, application performance monitoring, infrastructure monitoring, and advanced automation.
5. Which Datadog alternative is open source?
Prometheus and Zabbix are two of the most popular open-source Datadog alternatives. Grafana can also be self-hosted and is commonly used alongside Prometheus to build a complete open-source observability stack.
6. Which Datadog alternative offers the best value?
For organizations seeking a balance between functionality and cost, Grafana Cloud, New Relic, and Elastic Observability provide excellent value by combining comprehensive monitoring capabilities with flexible pricing and free plans for smaller deployments.