
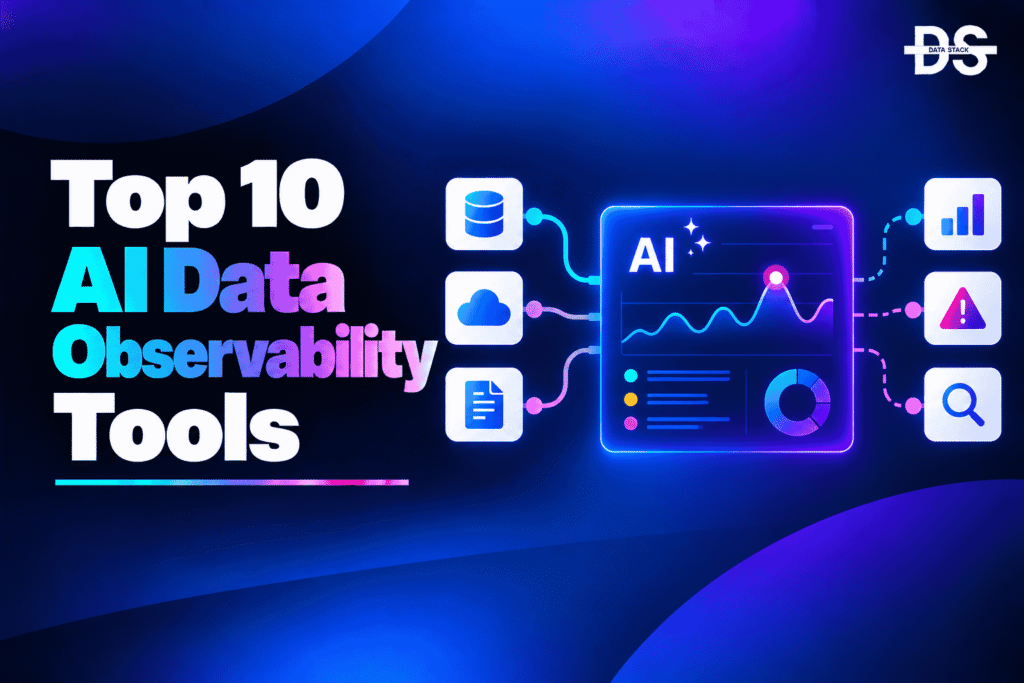
Modern data environments generate enormous volumes of data across warehouses, lakehouses, databases, pipelines, APIs, SaaS applications, and AI systems. As these environments become more complex, simply monitoring whether a pipeline has completed successfully is no longer enough. Data teams also need to know whether the data arriving at its destination is accurate, complete, fresh, consistent, and usable.
AI data observability tools use artificial intelligence and machine learning to make this monitoring more intelligent. Instead of relying entirely on manually defined rules and static thresholds, AI can learn normal data behavior, identify unusual changes, detect anomalies, investigate potential causes, and help data teams understand what went wrong.
AI is particularly useful because data problems are often difficult to identify through traditional infrastructure monitoring. A pipeline can complete successfully while delivering an unexpected number of records, a sudden change in distributions, missing values, duplicate data, or outdated information. These issues may remain undetected until they affect dashboards, analytics, machine learning models, or AI applications.
Modern observability platforms therefore combine data quality monitoring, anomaly detection, pipeline monitoring, lineage, incident management, and root-cause analysis. Some platforms use machine learning extensively for automated anomaly detection, while others combine AI with metadata, lineage, and data quality rules to accelerate investigation.
This article focuses on tools where AI or machine learning plays a meaningful role in data observability, anomaly detection, data quality monitoring, incident investigation, and understanding the health of modern data environments.
What Are AI Data Observability Tools?
AI data observability tools are platforms that use artificial intelligence, machine learning, or intelligent automation to monitor the health, quality, reliability, and behavior of data throughout its lifecycle.
Traditional data monitoring often depends on manually configured checks such as row counts, freshness thresholds, null percentages, or schema changes. AI-powered observability adds the ability to learn normal patterns and identify unusual behavior without requiring teams to manually define every possible condition.
For example, an AI-powered observability platform may recognize that a particular dataset normally receives millions of records every morning and identify a significant deviation as an anomaly. It can then use metadata, lineage, dependencies, and historical incidents to help determine which upstream change may have caused the problem.
AI Data Observability Tools vs. Traditional Data Monitoring
| Capability | Traditional Data Monitoring | AI Data Observability |
|---|---|---|
| Monitoring | Predefined checks and thresholds | Automated monitoring with intelligent detection |
| Anomaly detection | Manually defined rules | Machine learning and behavioral analysis |
| Data quality | Fixed quality tests | AI-assisted detection of unusual data behavior |
| Root-cause analysis | Manual investigation | AI-assisted investigation using lineage and metadata |
| Threshold management | Manually configured | Can learn historical patterns and expected behavior |
| Schema monitoring | Rule-based alerts | Intelligent change detection and context |
| Incident investigation | Manual analysis across systems | AI-assisted correlation and investigation |
| Data freshness | Static time thresholds | Historical behavior and pattern-based monitoring |
| Lineage | Used mainly for visibility | Can support automated impact and root-cause analysis |
| Alerting | Rule-based notifications | Contextual and anomaly-based alerts |
AI Data Observability Tools Comparison
The comparison table below provides a quick overview of the best AI data observability tools, highlighting their AI capabilities, automation features, and primary observability use cases.
| Tool | AI Capabilities | What You Can Automate | Primary Observability Focus | Best For |
|---|---|---|---|---|
| Monte Carlo | ML-based anomaly detection, intelligent monitoring, AI-assisted investigation | Anomaly detection, freshness, volume, schema, incident monitoring | Data quality and reliability | Enterprise data teams |
| Bigeye | ML anomaly detection, automated baselines, intelligent data quality monitoring | Data profiling, anomaly detection, freshness, volume, distributions | Data quality | Large-scale data environments |
| Anomalo | ML-based anomaly detection, automated data profiling | Anomaly detection, volume, distributions, missing values, schema | Automated data quality | Teams wanting ML-first monitoring |
| Soda | AI-assisted anomaly detection and data quality intelligence | Quality checks, anomaly detection, freshness, schema, data testing | Data quality and testing | Data engineering teams |
| Great Expectations | AI-data quality foundation, automated validation | Schema, completeness, uniqueness, type, range, quality testing | Data validation | Engineering teams needing explicit quality rules |
| BigQuery DataFrames | Python-based AI/ML analysis, statistical anomaly analysis | Profiling, quality analysis, anomaly analysis, data preparation | Warehouse-native data analysis | BigQuery users |
| Datadog | ML anomaly detection, AI-assisted investigation | Pipeline, infrastructure, logs, alerts, incident monitoring | Infrastructure and pipeline observability | Broader technical observability |
| New Relic | ML anomaly detection, AI-assisted incident analysis | Application, infrastructure, logs, pipeline monitoring | Operational observability | Application and infrastructure teams |
| Splunk | ML analytics, anomaly detection, intelligent event correlation | Logs, events, alerts, incident investigation | Operational and machine-data observability | Enterprise IT environments |
| Dynatrace | Davis AI, causal analysis, anomaly detection | Infrastructure, applications, events, root-cause analysis | Full-stack observability | Complex enterprise environments |
10 Best AI Data Observability Tools
Let’s take a closer look at the 10 best AI data observability tools and explore how their AI capabilities can help data teams detect anomalies, monitor data quality, investigate incidents, and maintain reliable data pipelines.
#1. Monte Carlo
Monte Carlo is a data observability platform designed to help organizations monitor the reliability and quality of data across modern data stacks. It provides capabilities for data quality monitoring, anomaly detection, lineage, incident management, and root-cause analysis, with machine learning playing an important role in identifying unusual behavior across data assets.
Monte Carlo’s observability approach goes beyond checking whether pipelines have completed successfully. Its machine learning capabilities can learn historical patterns in data and identify unexpected changes in metrics such as volume, freshness, distributions, and schema. This helps data teams detect problems that may not trigger traditional pipeline or infrastructure alerts.
The platform also connects observability signals with metadata and lineage to help teams investigate incidents. When an anomaly occurs, understanding which upstream pipeline, table, or source may have caused the problem can significantly reduce investigation time. This combination of automated anomaly detection and data lineage makes Monte Carlo particularly useful for organizations managing large and complex data environments.
AI Capabilities
- AI-powered anomaly detection: Uses machine learning to identify unusual changes in data behavior.
- Automated data monitoring: Monitors data assets and learns expected patterns across supported environments.
- Intelligent freshness monitoring: Identifies unexpected changes in data availability and delivery patterns.
- Data quality intelligence: Detects unusual changes in data characteristics that may indicate quality issues.
- Machine learning-based detection: Helps identify anomalies without requiring teams to manually define every possible threshold.
- AI-assisted root-cause analysis: Uses available lineage and metadata context to help investigate data incidents.
- Intelligent incident detection: Identifies potentially meaningful data problems while reducing reliance on static checks.
- Predictive data observability: Uses historical behavior to establish expectations for monitored data assets.
What You Can Automate
- Anomaly detection: Automatically identify unusual patterns in monitored datasets.
- Data freshness monitoring: Detect unexpected delays or changes in data delivery.
- Volume monitoring: Detect significant changes in expected record volumes.
- Schema monitoring: Identify unexpected changes to schemas and data structures.
- Data quality monitoring: Continuously monitor supported data quality signals.
- Incident creation: Generate alerts and incidents when significant anomalies are detected.
- Root-cause investigation: Use lineage and metadata to help identify upstream causes.
- Impact analysis: Understand which downstream data assets may be affected by an incident.
- Data reliability monitoring: Continuously track the health of critical data assets.
Best For
Data teams at organizations with large modern data stacks that need automated anomaly detection, data quality monitoring, lineage, and faster incident investigation.
AI Verdict
Monte Carlo’s strongest AI value comes from using machine learning to identify unexpected data behavior without requiring teams to manually anticipate every possible failure. Its combination of anomaly detection, observability, lineage, and incident management can help teams move from simply receiving alerts to understanding why data problems occurred. The effectiveness of automated detection still depends on sufficient historical data and appropriate monitoring configuration.
Also Read: Best Monte Carlo Alternatives & Competitors in 2026
Showcase your software to buyers actively comparing tools. Submit your product for editorial review and get featured on Data Stack Hub.
#2. Bigeye
Bigeye is a data observability platform focused on helping organizations monitor data quality, detect anomalies, and identify problems before they affect downstream analytics and applications. Its approach uses machine learning to establish expected data behavior and identify unusual changes across important data assets.
Bigeye can automatically analyze characteristics such as data volume, distributions, freshness, and other quality signals to detect deviations from normal behavior. This is useful in environments where manually creating tests for every table and column would be difficult to maintain. Machine learning can help identify patterns that may not be obvious through fixed threshold-based monitoring.
The platform also supports data quality monitoring and incident investigation, helping teams understand where data problems occur and which assets may be affected. For organizations with large numbers of tables and rapidly changing data pipelines, automated monitoring can reduce the amount of manual effort required to maintain data reliability.
AI Capabilities
- Machine learning anomaly detection: Learns expected data behavior and identifies unusual changes.
- AI-powered data quality monitoring: Monitors data characteristics to identify potential quality problems.
- Automated baseline creation: Uses historical data behavior to establish expectations for monitored assets.
- Intelligent distribution monitoring: Detects unexpected changes in the distribution of data values.
- AI-assisted freshness monitoring: Identifies unusual delays or changes in data availability.
- Intelligent volume monitoring: Detects unexpected changes in record counts and data volumes.
- Automated data profiling: Analyzes data characteristics to establish a better understanding of normal behavior.
- Anomaly investigation: Provides contextual information to help teams investigate detected issues.
What You Can Automate
- Data profiling: Automatically analyze supported datasets and their characteristics.
- Anomaly detection: Identify unusual changes without manually creating every threshold.
- Volume monitoring: Monitor changes in expected record counts.
- Distribution monitoring: Detect changes in value distributions and patterns.
- Freshness monitoring: Identify unexpected delays in data availability.
- Data quality monitoring: Continuously monitor supported data quality metrics.
- Alerts: Notify teams when meaningful deviations are detected.
- Data health monitoring: Track the reliability of important datasets over time.
- Incident investigation: Provide information that helps teams investigate data quality problems.
Best For
Data teams that need machine learning-based data quality monitoring and automated anomaly detection across large numbers of datasets.
AI Verdict
Bigeye’s primary AI value is its use of machine learning to establish data behavior baselines and identify deviations automatically. This can reduce the need for data teams to manually define individual monitoring thresholds for every asset. It is particularly useful when organizations have many datasets and need scalable data quality monitoring, although teams should still validate detected anomalies before treating every deviation as a production incident.
#3. Anomalo
Anomalo is a data quality and observability platform built around automated machine learning-based anomaly detection. It helps data teams monitor tables and identify unexpected changes in data without requiring them to manually create large numbers of data quality rules and thresholds.
Anomalo analyzes historical data behavior to understand what is normal for a dataset and then identifies unusual changes. Its machine learning approach can monitor multiple characteristics of data, including volume, distributions, missing values, schema changes, and other patterns that may indicate a data quality problem. This is useful for organizations where the number of datasets makes fully manual monitoring difficult to maintain.
The platform also provides context around detected anomalies so data teams can investigate potential issues more efficiently. Rather than simply reporting that a table changed, an observability platform can help teams understand which characteristics changed and determine whether the change represents a genuine data quality problem or an expected business event.
AI Capabilities
- Automated anomaly detection: Uses machine learning to identify unexpected changes in data.
- ML-based data quality monitoring: Learns historical patterns instead of relying only on fixed thresholds.
- Intelligent data profiling: Analyzes datasets to understand their normal characteristics.
- Distribution anomaly detection: Identifies unusual changes in the distribution of data values.
- Volume anomaly detection: Detects unexpected increases or decreases in dataset size.
- Missing-data detection: Identifies unusual changes in missing or null values.
- Schema anomaly detection: Detects unexpected changes to the structure of monitored datasets.
- AI-assisted anomaly context: Provides information to help teams understand the nature of detected changes.
What You Can Automate
- Data profiling: Automatically analyze monitored datasets and establish behavioral baselines.
- Anomaly detection: Continuously identify unusual data patterns.
- Volume monitoring: Detect unexpected changes in record counts.
- Distribution monitoring: Monitor changes in statistical distributions and data patterns.
- Missing-value monitoring: Detect unusual increases in missing or null values.
- Schema monitoring: Identify unexpected schema changes.
- Data quality monitoring: Continuously evaluate data behavior across monitored assets.
- Alerting: Notify teams when meaningful anomalies are detected.
- Anomaly investigation: Provide context around detected data quality issues.
Best For
Data teams that want automated machine learning-based data quality monitoring without having to manually define extensive rule sets for every dataset.
AI Verdict
Anomalo’s main differentiator is its machine learning-first approach to data quality. Instead of requiring teams to anticipate every potential problem and manually encode a corresponding test, it can learn expected data behavior and identify deviations. This approach can be valuable at scale, particularly when data environments contain many tables and changing data patterns. Human review remains important because not every statistical anomaly represents an actual data quality issue.
#4. Soda
Soda is a data quality and observability platform that helps data teams monitor, test, and troubleshoot data across modern data environments. It combines automated data quality checks with machine learning and AI-assisted capabilities to help teams identify anomalies, investigate issues, and maintain reliable data pipelines.
Soda can monitor data for changes in freshness, volume, schema, distributions, missing values, and other quality dimensions. Its observability approach combines automated checks with the ability to define business-specific expectations, giving teams flexibility to use both intelligent anomaly detection and explicit data quality rules.
Its AI capabilities are particularly useful for reducing the manual effort involved in creating and maintaining data quality monitoring. Instead of treating every dataset identically, teams can use automated analysis and historical behavior to identify unusual patterns, while Soda’s broader monitoring and testing capabilities allow data engineers to apply specific checks where business requirements demand them.
AI Capabilities
- AI-assisted anomaly detection: Helps identify unusual changes in monitored data.
- Machine learning-based monitoring: Uses historical behavior and data patterns to improve anomaly detection.
- Automated data profiling: Analyzes data characteristics to establish expectations around normal behavior.
- Intelligent data quality analysis: Helps identify potential quality problems across monitored datasets.
- AI-assisted troubleshooting: Provides context that can help data teams investigate detected issues.
- Intelligent freshness monitoring: Identifies unexpected changes in data delivery patterns.
- Automated quality intelligence: Combines data observations with quality signals to surface meaningful issues.
- AI-assisted monitoring recommendations: Helps reduce some of the manual effort involved in determining what should be monitored.
What You Can Automate
- Data quality checks: Continuously execute configured quality checks against monitored data.
- Anomaly detection: Identify unusual changes in data behavior.
- Data profiling: Analyze supported datasets and their characteristics.
- Freshness monitoring: Detect unexpected delays in data updates.
- Volume monitoring: Identify unusual changes in record counts and data volumes.
- Schema monitoring: Detect unexpected changes to data structures.
- Distribution monitoring: Identify changes in value distributions and statistical patterns.
- Data quality alerts: Notify relevant teams when monitored conditions or anomalies require attention.
- Data testing: Run automated tests as part of data development and production workflows.
Best For
Data engineering teams that want to combine AI-assisted observability with configurable data quality testing and monitoring across modern data pipelines.
AI Verdict
Soda is useful for teams that do not want to choose between automated anomaly detection and explicit data quality rules. Its observability capabilities can help identify unexpected behavior, while configurable checks allow engineers to enforce requirements that are too important to leave entirely to statistical detection. This combination makes it suitable for organizations that want both intelligent monitoring and direct control over their data quality standards.
#5. Great Expectations
Great Expectations is an open-source data quality and testing framework that helps data teams define, validate, and document expectations about their data. It is primarily a data quality tool rather than a traditional AI-first observability platform, but it can play an important role in AI data observability workflows by providing automated validation and reliable quality signals for data pipelines.
The platform allows teams to define expectations around values, schemas, completeness, uniqueness, distributions, and other characteristics of their datasets. These expectations can be executed automatically as data moves through pipelines, helping identify problems before unreliable data reaches downstream analytics, machine learning models, or AI applications.
Great Expectations is particularly useful when organizations need explicit, testable definitions of data quality. While machine learning-based observability tools attempt to learn what normal data looks like, Great Expectations allows teams to directly state what should be true about the data. This makes it a complementary approach for AI-driven data environments where critical data requirements need deterministic validation.
AI Capabilities
- AI data quality foundation: Provides structured quality signals that can support AI and machine learning data workflows.
- Automated data validation: Continuously validates data against defined expectations.
- Intelligent data quality workflows: Can be incorporated into automated data pipelines and observability processes.
- Data quality profiling: Helps teams understand dataset characteristics before defining or applying expectations.
- Automated quality documentation: Generates documentation around defined data expectations and validation results.
- Data anomaly support: Validation failures can provide signals for identifying unexpected data behavior.
- Pipeline-integrated quality monitoring: Allows quality checks to run automatically as part of data workflows.
- AI-ready data validation: Helps ensure datasets meet predefined quality requirements before being consumed by AI systems.
What You Can Automate
- Schema validation: Verify that datasets conform to expected structures.
- Data completeness checks: Identify missing or incomplete data.
- Uniqueness validation: Check whether values that should be unique remain unique.
- Data type validation: Verify that columns contain expected data types.
- Range validation: Ensure values fall within defined acceptable ranges.
- Data quality testing: Run automated expectations against datasets.
- Pipeline validation: Integrate quality checks into data pipelines and workflows.
- Quality reporting: Generate documentation and results from validation runs.
- AI data validation: Validate important datasets before they are used by machine learning or AI applications.
Best For
Data engineering teams that need open-source, test-driven data quality validation and want explicit controls over what constitutes acceptable data.
AI Verdict
Great Expectations is different from AI-first observability platforms because its core strength is deterministic data validation rather than machine learning-based anomaly detection. That distinction can actually make it valuable in AI data workflows. Statistical anomaly detection can identify unexpected behavior, while explicit expectations can enforce critical requirements such as schema, completeness, uniqueness, and valid ranges. Teams looking for AI-powered observability may therefore use it alongside an observability platform rather than treating it as a direct replacement for one.
Increase your product visibility by reaching software buyers researching the best tools. Every submission is reviewed by our editorial team.
Feature My Tool →#6. BigQuery DataFrames
BigQuery DataFrames is Google’s Python interface for working with data in BigQuery using familiar pandas and scikit-learn-style APIs. While it is not a dedicated data observability platform, its integration with BigQuery and Google’s data and AI ecosystem makes it relevant to AI-driven data quality and monitoring workflows, particularly for teams already using BigQuery for analytics and machine learning.
BigQuery provides data quality and monitoring capabilities that can be combined with machine learning and AI workflows to identify unusual patterns, validate datasets, and investigate changes in data. BigQuery DataFrames can make these capabilities accessible to Python-oriented data teams without requiring them to move large datasets out of the warehouse for every analysis.
For organizations building AI systems directly on their warehouse data, this can be useful because data quality analysis can remain close to the underlying data. Teams can use Python-based workflows to profile datasets, analyze distributions, identify anomalies, and prepare data for machine learning or AI applications without creating unnecessary data movement.
AI Capabilities
- Python-based AI data analysis: Provides a familiar Python interface for analyzing data stored in BigQuery.
- Machine learning integration: Supports workflows that use BigQuery data for machine learning analysis.
- AI-assisted data quality analysis: Can be used to analyze datasets and identify unusual patterns programmatically.
- Data profiling: Enables teams to examine distributions, missing values, outliers, and other characteristics.
- Statistical anomaly analysis: Supports Python-based analysis for identifying unexpected data behavior.
- Warehouse-native AI workflows: Keeps data analysis close to the underlying BigQuery environment.
- AI data preparation: Supports preparation and validation workflows for machine learning datasets.
- Scalable data analysis: Uses BigQuery’s underlying infrastructure for large-scale data processing.
What You Can Automate
- Data profiling: Analyze large datasets using Python-based workflows.
- Quality analysis: Run automated checks against data stored in BigQuery.
- Anomaly analysis: Identify unusual values, distributions, or patterns.
- Missing-data analysis: Detect unexpected changes in missing or null values.
- Outlier detection: Identify unusual observations in datasets.
- Data preparation: Transform and prepare data for machine learning workflows.
- Model-related data checks: Validate data used in machine learning and AI processes.
- Monitoring workflows: Schedule or integrate Python-based analysis into broader data workflows.
- AI data validation: Analyze datasets before they are consumed by AI applications.
Best For
Teams already using Google BigQuery that want to perform Python-based data quality, analysis, and machine learning workflows close to their warehouse data.
AI Verdict
BigQuery DataFrames should be viewed as an AI and data analysis interface rather than a dedicated data observability product. Its value in this category comes from enabling Python-based analysis and machine learning workflows directly against BigQuery data. For organizations that need centralized observability features such as automatic incident management, cross-platform lineage, and enterprise-wide anomaly monitoring, a dedicated observability platform will generally provide broader capabilities.
#7. Datadog
Datadog is an observability and monitoring platform that provides visibility across infrastructure, applications, logs, metrics, cloud environments, and data pipelines. Its AI capabilities, including machine learning-based anomaly detection and AI-assisted investigation, can help organizations identify unusual behavior across technical and data environments.
Although Datadog is not primarily a data observability platform, it can monitor data pipelines and the infrastructure supporting them. Its observability model brings metrics, logs, traces, events, and other signals together, allowing teams to investigate problems across different parts of a technology environment. This can be useful when a data-quality issue is connected to an infrastructure, application, or pipeline problem.
Datadog’s AI and machine learning capabilities can identify abnormal patterns and assist with incident investigation. For data engineering teams, this can provide an additional layer of visibility around pipeline health, processing systems, infrastructure dependencies, and operational conditions that may contribute to data incidents.
AI Capabilities
- AI-powered anomaly detection: Uses machine learning to identify unusual patterns across monitored signals.
- Machine learning monitoring: Establishes behavioral baselines and detects deviations.
- AI-assisted incident investigation: Helps teams investigate operational problems using available observability data.
- Intelligent alerting: Helps identify meaningful changes across monitored systems.
- AI-assisted root-cause analysis: Provides contextual information that can support investigation of incidents.
- Cross-system observability: Connects metrics, logs, traces, events, and other signals.
- Intelligent infrastructure monitoring: Detects abnormal behavior in infrastructure supporting data pipelines.
- AI-assisted troubleshooting: Helps teams interpret large volumes of monitoring information during incidents.
What You Can Automate
- Pipeline monitoring: Monitor operational metrics associated with data pipelines.
- Infrastructure monitoring: Track systems and infrastructure supporting data workloads.
- Anomaly detection: Identify unusual patterns across monitored metrics and events.
- Log monitoring: Collect and analyze logs associated with data systems and pipelines.
- Alerting: Trigger alerts when configured conditions or anomalous behavior are detected.
- Incident management: Create and manage operational incidents based on monitoring signals.
- Root-cause investigation: Correlate signals across systems to help identify potential causes.
- Performance monitoring: Monitor the performance of infrastructure and applications supporting data workflows.
- Operational data monitoring: Analyze technical signals that may indicate problems affecting data availability or reliability.
Best For
Organizations that want to combine data pipeline monitoring with broader infrastructure, application, log, and cloud observability.
AI Verdict
Datadog is best viewed as a broader observability platform that can contribute to data pipeline and operational observability, rather than as a specialized data-quality platform. Its AI and machine learning capabilities are useful when data problems are connected to infrastructure, applications, or pipeline operations. Organizations primarily concerned with data freshness, distributions, schema changes, and table-level quality may find dedicated data observability platforms more directly aligned with those requirements.
#8. New Relic
New Relic is an observability platform that uses machine learning and AI to monitor applications, infrastructure, logs, services, and operational data. While it is not a dedicated data observability platform, its AI-powered monitoring capabilities can be useful for organizations that need to observe the technical systems and pipelines responsible for producing, processing, and delivering data.
New Relic’s machine learning capabilities can help identify anomalies across telemetry data and establish a better understanding of normal system behavior. Its broader observability environment brings together metrics, logs, traces, events, and other signals, allowing teams to investigate problems that may affect data pipelines or downstream data availability.
For data engineering teams, this is particularly relevant when data reliability depends on infrastructure and applications. A delayed dataset, for example, may be caused by a failing service, database issue, API problem, resource constraint, or pipeline failure. AI-assisted observability can help correlate these operational signals and provide additional context during investigation.
AI Capabilities
- AI-powered anomaly detection: Uses machine learning to identify unusual patterns across monitored telemetry.
- Machine learning monitoring: Learns system behavior and helps detect deviations from expected conditions.
- AI-assisted incident analysis: Helps teams investigate operational problems using correlated observability data.
- Intelligent alerting: Helps surface important changes across applications and infrastructure.
- AI-assisted root-cause analysis: Uses available telemetry and relationships to support incident investigation.
- Intelligent log analysis: Helps teams analyze large volumes of operational logs.
- Cross-system observability: Correlates metrics, logs, traces, and events across monitored systems.
- AI-assisted troubleshooting: Helps engineers understand operational problems more efficiently.
What You Can Automate
- Pipeline infrastructure monitoring: Monitor systems supporting data processing workflows.
- Application monitoring: Track services that produce or consume data.
- Log monitoring: Collect and analyze logs associated with data systems.
- Anomaly detection: Identify unusual patterns across operational telemetry.
- Alerting: Notify teams about detected issues or configured conditions.
- Incident management: Create and manage incidents associated with monitored systems.
- Root-cause investigation: Correlate telemetry from multiple systems during incidents.
- Performance monitoring: Track infrastructure and application performance.
- Data pipeline operations: Monitor technical conditions that can affect data availability and reliability.
Best For
Organizations that need AI-assisted observability across applications, infrastructure, services, and data pipeline operations rather than a specialized table-level data quality platform.
AI Verdict
New Relic can contribute to AI-driven data observability when pipeline reliability depends heavily on applications and infrastructure. Its AI and machine learning capabilities can help identify abnormal operational behavior and correlate signals during investigations. However, it is not primarily designed for specialized data quality monitoring such as column distributions, table freshness, or semantic data validation, so organizations should evaluate it alongside dedicated data observability platforms when those capabilities are required.
#9. Splunk
Splunk is a data platform and observability solution that helps organizations collect, analyze, monitor, and investigate machine-generated data. Its AI and machine learning capabilities can detect anomalies, correlate events, and assist teams in investigating operational problems across applications, infrastructure, security, and data environments.
Splunk’s strength comes from its ability to bring together large volumes of logs, metrics, events, and other machine data. AI and machine learning can then be applied to identify unusual behavior and provide additional context around operational incidents. For data engineering teams, this can be useful when data pipeline failures or data availability problems generate signals across multiple infrastructure and application systems.
Splunk’s broader observability capabilities also support investigation by connecting related events and telemetry. This can help teams move beyond individual alerts and understand whether a data-related issue is part of a larger operational problem involving databases, applications, cloud infrastructure, or other dependencies.
AI Capabilities
- AI-powered anomaly detection: Uses machine learning to identify unusual patterns in operational data.
- Machine learning analytics: Applies machine learning to large volumes of machine-generated data.
- AI-assisted investigation: Helps teams analyze and correlate information during incidents.
- Intelligent event correlation: Connects related events and signals to provide additional context.
- AI-assisted root-cause analysis: Supports investigation of potential causes across interconnected systems.
- Predictive analytics: Supports analysis of historical and operational patterns.
- Intelligent alerting: Helps identify meaningful changes across monitored environments.
- AI-assisted observability: Uses AI and machine learning to improve understanding of operational telemetry.
What You Can Automate
- Log collection: Collect and analyze logs from applications and infrastructure.
- Event monitoring: Monitor events generated by data systems and applications.
- Anomaly detection: Identify unusual operational behavior.
- Alerting: Notify teams about important events and detected anomalies.
- Event correlation: Connect related signals from multiple systems.
- Incident investigation: Bring together logs, metrics, and events during troubleshooting.
- Root-cause analysis: Use correlated observability data to investigate potential causes.
- Infrastructure monitoring: Monitor infrastructure supporting data pipelines and applications.
- Operational data analysis: Analyze large volumes of machine-generated data.
Best For
Organizations that want AI-assisted observability across logs, metrics, events, infrastructure, applications, and data pipeline operations.
AI Verdict
Splunk is a strong fit when data observability is part of a broader IT and operational observability strategy. Its AI and machine learning capabilities can help teams detect anomalies and correlate signals across complex environments. However, organizations looking specifically for specialized data observability should distinguish between monitoring the systems that produce data and monitoring the actual quality, freshness, and characteristics of the data itself.
Also Read: Best Splunk Alternatives and Competitors
#10. Dynatrace
Dynatrace is an AI-powered observability platform designed to monitor applications, infrastructure, cloud environments, services, logs, traces, and other operational data. Its Davis AI capabilities use artificial intelligence and causal analysis to help identify anomalies, correlate related events, and support root-cause investigation.
Dynatrace’s approach is broader than traditional data observability. It focuses on understanding the relationships between applications, infrastructure, services, and other components of a technology environment. This can be useful for data engineering teams when data reliability problems originate outside the data layer, such as infrastructure failures, application errors, service dependencies, or resource constraints.
The platform can provide a unified view of operational signals and use AI to help determine which conditions may be contributing to an incident. For organizations running complex data platforms, this can complement specialized data observability by providing visibility into the infrastructure and applications underneath data pipelines.
AI Capabilities
- Davis AI: Uses AI to analyze observability data and support automated investigation.
- AI-powered anomaly detection: Identifies unusual behavior across monitored applications and infrastructure.
- Causal analysis: Helps identify relationships between events and potential causes.
- AI-assisted root-cause analysis: Supports investigation of complex incidents.
- Intelligent event correlation: Connects related monitoring signals across systems.
- Predictive analytics: Uses historical information to identify potential operational issues.
- AI-assisted observability: Combines telemetry and AI to improve system understanding.
- Intelligent dependency analysis: Helps teams understand relationships between applications, services, and infrastructure.
What You Can Automate
- Infrastructure monitoring: Monitor systems supporting data and application workloads.
- Application monitoring: Track applications and services involved in data workflows.
- Anomaly detection: Automatically identify unusual operational behavior.
- Log monitoring: Analyze logs associated with applications and infrastructure.
- Event correlation: Connect related events across complex environments.
- Incident detection: Identify conditions that may require investigation.
- Root-cause analysis: Use AI and causal relationships to support troubleshooting.
- Dependency analysis: Understand relationships between systems and services.
- Performance monitoring: Track the performance of infrastructure and applications supporting data workloads.
Best For
Enterprises that need AI-powered observability across applications, infrastructure, cloud environments, and the operational systems supporting their data platforms.
AI Verdict
Dynatrace is most relevant when organizations want AI-powered observability that extends beyond the data layer into applications, infrastructure, and service dependencies. Its AI and causal analysis capabilities can help investigate operational conditions that affect data reliability. Like Datadog, New Relic, and Splunk, it should not be confused with specialized data observability platforms that focus directly on table-level data quality, freshness, distributions, and pipeline data health.
How to Choose the Right AI Data Observability Tool
Choosing the right AI data observability tool depends on what you need to monitor, how much of the monitoring process you want to automate, and whether your biggest problems occur within the data itself or in the infrastructure and pipelines that produce it.
- AI-powered anomaly detection: Check whether the platform can learn normal data behavior and identify unusual changes without requiring teams to manually define every possible threshold.
- Data quality monitoring: Look for support for important quality dimensions such as completeness, accuracy, validity, uniqueness, distributions, and unexpected changes in data values.
- Data freshness: Make sure the platform can detect delayed or missing data deliveries and understand the normal update patterns of important datasets.
- Volume monitoring: Check whether the tool can identify unexpected increases or decreases in record counts and data volumes.
- Schema monitoring: Look for automatic detection of added, removed, renamed, or changed columns and other unexpected structural changes.
- Distribution monitoring: Evaluate whether the platform can detect meaningful changes in statistical distributions rather than relying only on simple row-count checks.
- Machine learning baselines: Determine whether AI can establish baselines from historical behavior and adapt as legitimate data patterns change.
- False-positive management: AI observability is only useful when alerts are actionable. Check how the platform handles expected changes, recurring anomalies, and noisy signals.
- Root-cause analysis: Look for AI capabilities that help determine why an anomaly occurred instead of simply notifying you that something changed.
- Data lineage: Lineage is particularly important for investigating data incidents. The tool should help trace a problem from downstream tables or dashboards toward potentially affected upstream sources.
- Impact analysis: Check whether the platform can identify downstream datasets, reports, models, or applications that could be affected by a data incident.
- AI-assisted incident investigation: Evaluate whether the platform can summarize incidents, correlate related signals, and reduce the amount of manual investigation required from data engineers.
- Data pipeline monitoring: Check whether the tool monitors pipeline execution, failures, delays, and dependencies in addition to the data produced by those pipelines.
- Infrastructure observability: If pipeline reliability depends heavily on cloud infrastructure, databases, APIs, or applications, consider whether you need broader infrastructure and application observability alongside data observability.
- Automated monitoring coverage: Determine how easily the platform can automatically begin monitoring new tables and datasets. This becomes increasingly important as the number of data assets grows.
- Custom data quality rules: AI-based detection should not completely replace deterministic checks. Make sure you can define explicit rules for critical business requirements.
- Data profiling: Look for automated profiling that can help establish a baseline for new datasets and identify important characteristics before production monitoring begins.
- Alerting and notifications: Check whether alerts can reach the right teams through the communication and incident-management systems you already use.
- Integration with your data stack: Evaluate support for your warehouses, databases, lakehouses, transformation tools, orchestration platforms, BI tools, and cloud infrastructure.
- Observability across AI data pipelines: If you are building machine learning or generative AI systems, check whether the platform can monitor the data feeding those systems and identify changes that could affect AI workloads.
- AI-generated explanations: Some platforms can explain detected anomalies or summarize incidents. Test these capabilities using real incidents rather than relying only on vendor demonstrations.
- Data observability vs. infrastructure observability: This distinction is important. Tools such as Monte Carlo, Bigeye, Anomalo, and Soda focus more directly on data health, while platforms such as Datadog, New Relic, Splunk, and Dynatrace provide broader observability across infrastructure and applications.
- Scalability: Consider how the platform performs as your number of tables, pipelines, columns, events, and monitored environments grows.
- Governance and security: Review how monitoring data, metadata, schemas, logs, and AI-related information are processed and protected.
- Cost and monitoring volume: Understand how pricing changes as you add datasets, columns, users, events, or monitoring workloads.
- Actual engineering time saved: Ultimately, evaluate whether AI reduces the time your team spends writing monitoring rules, investigating incidents, identifying root causes, and responding to data quality problems.
Browse expertly curated software recommendations across hundreds of business categories.
Browse Top Tools →Conclusion
AI data observability is becoming increasingly important as organizations operate larger data platforms and use that data for analytics, machine learning, and generative AI. Traditional pipeline monitoring can tell teams whether a job completed, but it does not necessarily tell them whether the resulting data is reliable or whether its behavior has changed unexpectedly.
The tools covered in this article take different approaches to the problem. Monte Carlo, Bigeye, Anomalo, and Soda are more directly focused on data observability, automated monitoring, anomaly detection, and data quality. Great Expectations provides a more deterministic, test-driven approach to data validation, making it useful for teams that want explicit quality expectations alongside automated monitoring.
Platforms such as Datadog, New Relic, Splunk, and Dynatrace take a broader approach to observability. Their AI and machine learning capabilities can help monitor the infrastructure, applications, services, logs, and operational systems that support data pipelines. They can therefore be particularly useful when data reliability problems are connected to broader technical issues.
When evaluating AI data observability tools, focus on the capabilities that matter most to your environment: anomaly detection, freshness monitoring, volume and distribution changes, schema monitoring, lineage, root-cause analysis, incident management, and integrations with your existing data stack.
AI should also complement—not completely replace—deterministic data quality checks. Business-critical requirements such as acceptable ranges, required fields, uniqueness, and specific schema rules may need explicit validation even when machine learning is used to detect unexpected behavior.
For AI and machine learning environments, observability becomes even more important because poor-quality or unexpected data can affect downstream models and AI applications. A strong observability layer can help teams detect changes earlier, investigate their causes, and maintain greater confidence in the data powering these systems.
The right AI data observability tool ultimately depends on whether you need specialized data health monitoring, broader infrastructure observability, or a combination of both.
Frequently Asked Questions
1. What are AI data observability tools?
AI data observability tools are platforms that use artificial intelligence, machine learning, or intelligent automation to monitor the health, quality, freshness, reliability, and behavior of data across pipelines and data environments.
2. How are AI data observability tools different from traditional data monitoring?
Traditional data monitoring often depends on predefined rules, thresholds, and manually configured tests. AI data observability tools can use machine learning to learn historical patterns, detect unusual behavior, identify anomalies, and assist with incident investigation.
3. What can AI automate in data observability?
AI can help automate anomaly detection, data profiling, freshness monitoring, volume monitoring, distribution monitoring, incident investigation, root-cause analysis, and alerting.
4. Can AI detect data quality problems automatically?
Yes. AI and machine learning can identify unusual changes in data behavior, including unexpected changes in volume, distributions, missing values, freshness, and other monitored characteristics. However, teams should validate whether an anomaly represents an actual quality problem.
5. What is AI-powered anomaly detection?
AI-powered anomaly detection uses machine learning and historical data behavior to identify patterns that differ significantly from what is normally expected. This can reduce the need to manually create a separate threshold for every dataset or metric.
6. Can AI data observability tools monitor data freshness?
Yes. Data freshness monitoring can identify when datasets are updated later than expected, stop receiving updates, or deviate from their normal delivery patterns.
7. Can AI monitor data pipelines?
Yes. Many observability platforms can monitor pipeline execution, failures, delays, dependencies, and the resulting data. Broader observability platforms can also monitor the infrastructure and applications supporting those pipelines.
8. Can AI data observability tools perform root-cause analysis?
Some platforms use AI, machine learning, metadata, and lineage to help investigate the potential causes of data incidents. These capabilities can correlate related signals and point teams toward upstream systems or changes that may have contributed to an issue.
9. What is the role of data lineage in AI observability?
Data lineage shows how data moves between sources, pipelines, tables, dashboards, models, and other assets. Observability platforms can use lineage to help determine the potential source of an anomaly and identify downstream assets that may be affected.
10. Can AI data observability replace data quality testing?
Not completely. AI-based anomaly detection and deterministic data quality tests serve different purposes. AI can identify unexpected patterns, while explicit tests can enforce requirements such as valid ranges, required fields, uniqueness, and specific schemas.
11. What are the best AI data observability tools in 2026?
The tools covered in this article are:
- Monte Carlo
- Bigeye
- Anomalo
- Soda
- Great Expectations
- BigQuery DataFrames
- Datadog
- New Relic
- Splunk
- Dynatrace
These tools differ significantly in scope. Some focus specifically on data quality and data observability, while others provide broader AI-powered observability across infrastructure, applications, logs, and data pipelines.
12. Is Monte Carlo an AI data observability tool?
Yes. Monte Carlo uses machine learning for capabilities such as anomaly detection and data monitoring, while also providing data lineage, incident management, and other observability functionality.
13. Is Great Expectations an AI data observability tool?
Great Expectations is primarily an open-source data quality and validation framework, rather than an AI-first observability platform. It can complement AI observability by providing deterministic tests and validation for critical data requirements.
14. Are Datadog and Dynatrace data observability tools?
Datadog and Dynatrace are broader observability platforms rather than specialized data observability products. They can monitor infrastructure, applications, services, logs, and systems supporting data pipelines, making them useful for operational aspects of data observability.
15. Can AI data observability tools monitor data used by AI applications?
Yes. AI observability can help monitor the data feeding machine learning and generative AI systems. Detecting changes in data quality, distributions, freshness, or schemas can help teams identify issues that could affect downstream AI workloads.
16. Can AI data observability tools reduce false alerts?
They can help reduce alert noise by learning expected behavior and focusing attention on unusual patterns. However, false positives can still occur, so teams should evaluate how each platform handles expected changes, baseline adjustments, alert suppression, and anomaly sensitivity.
17. What should I look for in an AI data observability tool?
Key factors include AI-powered anomaly detection, data quality monitoring, freshness monitoring, schema monitoring, volume and distribution analysis, lineage, root-cause analysis, incident management, integrations, scalability, security, and support for deterministic quality rules.
18. Do AI data observability tools work with cloud data warehouses?
Many do. Support varies by vendor, so check compatibility with the specific warehouses, databases, lakehouses, transformation tools, orchestration platforms, and BI systems used by your organization.
19. Can AI data observability tools detect schema changes?
Yes. Schema monitoring can identify unexpected changes such as added, removed, renamed, or modified columns. Some platforms can also provide context about the potential downstream impact of those changes.
20. What is the difference between data observability and infrastructure observability?
Data observability focuses on the health and reliability of the data itself, including freshness, volume, distributions, schema, and quality. Infrastructure observability focuses on the systems that produce and process the data, including servers, applications, databases, services, logs, and cloud infrastructure. Many organizations use both layers together.