
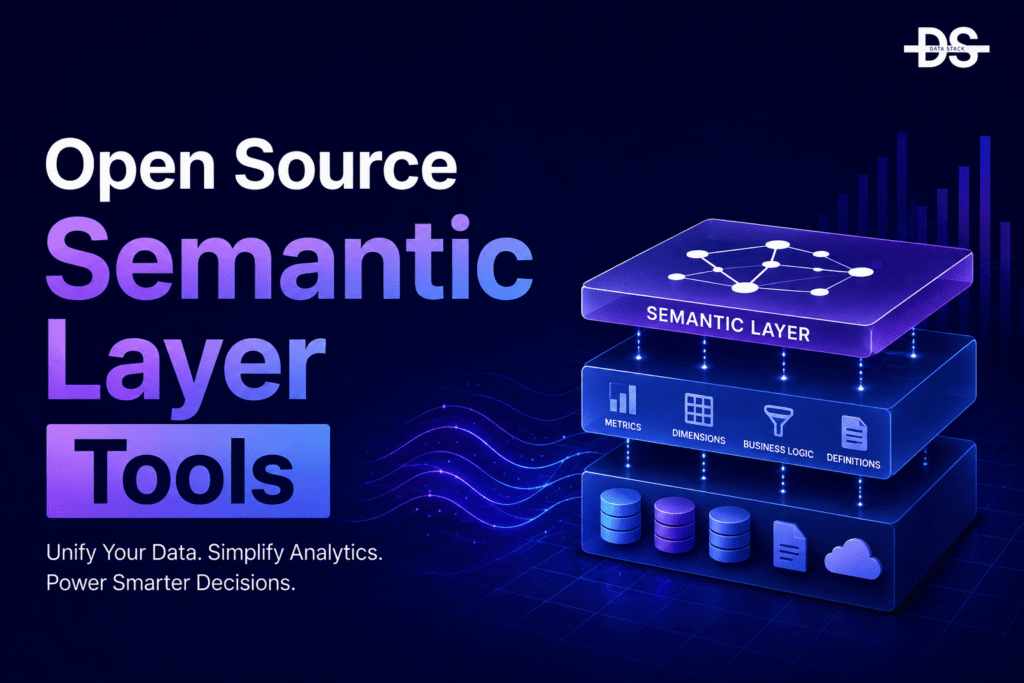
A semantic layer solves one of the most persistent problems in analytics: different teams calculating the same business metric in different ways. Revenue, active users, churn, conversion rate, and other important metrics can easily produce conflicting numbers when their logic is recreated across dashboards, SQL queries, spreadsheets, and applications. A semantic layer provides a shared place to define those metrics and make them reusable.
Open source semantic layer tools give data teams more control over where that business logic lives and how it is consumed. Depending on the platform, they can support governed metrics, reusable dimensions, entity definitions, query APIs, BI integrations, embedded analytics, caching, and programmatic workflows. Some are designed as dedicated semantic serving layers, while others extend dbt projects or open-source analytics platforms with semantic modeling capabilities.
The best open-source semantic layer tool depends on how your data team works today. A dbt-centric organization may prioritize metric definitions that live alongside transformation models, while a company building embedded analytics may need APIs, caching, and multi-tenant access. This list covers the top free and open source semantic layer tools, along with non-open-source tools and platforms for teams comparing different approaches to governed analytics.
What is a Semantic Layer Tool?
A semantic layer tool creates a common business-friendly representation of data that sits between raw or modeled data and the people, dashboards, applications, or systems consuming it. Instead of every analyst or BI tool independently defining how revenue, customers, orders, or other metrics should be calculated, teams can establish those definitions once and reuse them across multiple environments.
Open source semantic layer tools can take different approaches to this problem. Some focus on defining and serving metrics through APIs and query interfaces, while others integrate closely with transformation workflows or analytics platforms. The goal is the same: reduce duplicated business logic and give teams a more consistent, governed source for the metrics used across the organization.
Open Source Semantic Layer Tools Comparison for 2026
| Tool Name | Category | Best For | Key Strength | Deployment Options | Licensing | G2 Rating |
|---|---|---|---|---|---|---|
| Cube | Headless Semantic Layer | Embedded analytics and data applications | APIs, caching, and reusable data models | Self-hosted, cloud, Docker, Kubernetes | Apache 2.0 | Not available |
| dbt Semantic Layer | Metrics Layer | dbt-centric data teams | Centralized metric definitions | Cloud, self-managed dbt environments | Open source components with commercial offerings | 4.7/5 (204 reviews) |
| Lightdash | BI and Semantic Modeling | dbt users building self-service analytics | Metrics directly connected to dbt models | Self-hosted, cloud, Docker, Kubernetes | MIT | 4.9/5 (19 reviews) |
| Wren AI | Semantic Engine | AI-assisted data analytics | Semantic modeling for natural-language analytics | Self-hosted, Docker, cloud | Apache 2.0 | Not available |
| Malloy | Data Modeling Language | Analytics engineering and governed queries | Code-based semantic data modeling | Self-hosted development environments | Apache 2.0 | Not available |
| Evidence | Analytics Framework | Data teams building analytics applications | Metrics and data logic in code | Self-hosted, cloud deployment | MIT | Not available |
| Apache Superset | BI Platform | Organizations combining reusable datasets and BI | Reusable datasets and metrics | Self-hosted, Docker, Kubernetes, cloud | Apache 2.0 | 4.4/5 (50 reviews) |
| Metriql | Metrics Layer | Centralized metrics and analytics APIs | API-first metric definitions | Self-hosted, cloud infrastructure | Open source | Not available |
The 8 Best Open Source Semantic Layer Tools in 2026
The best open source semantic layer tools help organizations define business metrics once and make them available across dashboards, applications, APIs, and analytics workflows. The right platform depends on whether your priority is embedded analytics, dbt integration, AI-powered querying, reusable metrics, or a broader open-source BI environment.
#1 Cube
Cube is one of the most established open source semantic layer tools, particularly for organizations building data applications, embedded analytics products, and customer-facing dashboards. It acts as a headless data layer between underlying databases and the applications or BI experiences that consume the data.
Instead of allowing every dashboard or application to generate its own SQL and business logic, Cube enables teams to define data models, measures, dimensions, and relationships centrally. Those definitions can then be exposed through APIs, allowing different applications to work from the same underlying business logic.
One of Cube’s biggest strengths is its suitability for product and embedded analytics use cases. It provides APIs and caching capabilities that can help applications deliver analytical experiences without requiring every frontend application to communicate directly with the underlying warehouse.
Key Features
- Centralized semantic modeling: Cube allows teams to define measures, dimensions, joins, and relationships in a reusable data model.
- API-first architecture: Data can be exposed through APIs, making Cube suitable for web applications, embedded analytics, and custom data products.
- Query caching and pre-aggregations: Helps improve performance for frequently accessed analytical queries and high-concurrency environments.
- Multiple database integrations: Can connect with modern cloud data warehouses and databases used in analytical architectures.
- Embedded analytics support: Provides a backend data layer for teams building analytics directly into SaaS products and applications.
- Access-control capabilities: Supports controlled access to data and can help organizations implement tenant-aware analytics experiences.
Best For
Cube is best for organizations building embedded analytics, customer-facing dashboards, and data applications that need a dedicated open source semantic layer with APIs, performance optimization, and reusable business logic.
#2 dbt Semantic Layer
dbt Semantic Layer is designed for organizations that already use dbt as the foundation of their analytics engineering workflow. Rather than treating metric definitions as separate from transformation logic, it extends the data modeling process by allowing teams to define business metrics alongside their existing data models.
This approach can reduce duplication between transformation projects and downstream analytics tools. Instead of recreating metric logic in multiple dashboards, teams can establish common definitions and make them available to supported consumers.
For modern analytics teams that already manage transformations through dbt, the semantic layer can provide a more natural path toward metric governance than introducing an entirely separate modeling system.
Key Features
- Centralized metric definitions: Allows business metrics to be defined consistently rather than recreated across multiple analytics tools.
- Integration with dbt models: Keeps semantic definitions closely connected to the transformed data models they represent.
- Metric governance: Helps reduce inconsistencies in how commonly used KPIs are calculated.
- Reusable dimensions and entities: Supports common definitions that can be reused across analytics workflows.
- Analytics ecosystem integration: Makes governed metrics available to compatible BI and analytics tools.
- Data-as-code workflow: Fits naturally into version-controlled analytics engineering processes.
Best For
dbt Semantic Layer is best for dbt-centric data teams that want to centralize metric definitions and reduce inconsistencies across analytics tools without moving their modeling workflow to a separate semantic platform.
Showcase your software to buyers actively comparing tools. Submit your product for editorial review and get featured on Data Stack Hub.
Submit Your Tool →#3 Lightdash
Lightdash is an open-source BI platform built around the dbt ecosystem. While it is broader than a standalone semantic layer, its approach to metrics and dimensions makes it particularly relevant for teams looking to create a governed analytics experience from their existing dbt models.
Instead of requiring analysts to manually recreate every metric inside a separate BI tool, Lightdash can use the structure and metadata already maintained in a dbt project. This creates a closer relationship between transformation logic and the analytics layer used by business teams.
For organizations that want both self-service BI and a more consistent semantic approach, Lightdash can reduce the separation between analytics engineering and dashboard development.
Key Features
- dbt-native modeling: Connects analytics experiences with models and metadata managed in dbt projects.
- Reusable metrics and dimensions: Allows teams to establish common analytical definitions for self-service reporting.
- Self-service exploration: Business users can explore governed datasets without writing every query manually.
- Dashboard and reporting capabilities: Extends semantic modeling into a complete analytics and visualization environment.
- Version-controlled workflows: Works naturally with teams already managing analytics logic through code.
- Self-hosting options: Can be deployed as part of an organization’s own analytics infrastructure.
Best For
Lightdash is best for teams that want to combine dbt-based semantic modeling with self-service BI and dashboards rather than deploying a separate semantic layer and visualization platform.
#4 Wren AI
Wren AI takes a different approach to the semantic layer by focusing on how structured data can be made easier for AI systems and business users to understand. It provides a semantic modeling layer that can help translate business concepts into a structure that supports natural-language analytics and AI-assisted querying.
As organizations increasingly experiment with conversational analytics, a raw database schema is often not enough. Tables and columns may have technical names that do not match the language used by business teams. A semantic model can provide additional context around relationships, metrics, and business concepts.
Wren AI is particularly relevant for teams exploring AI-driven analytics experiences while still wanting greater control over the data definitions that sit behind those experiences.
Key Features
- Semantic data modeling: Helps organize data around understandable business concepts rather than raw database structures alone.
- Natural-language analytics support: Designed to support AI systems that translate user questions into data queries.
- Business context for data: Can provide additional meaning around tables, metrics, and relationships.
- AI-assisted data exploration: Supports conversational approaches to querying and understanding analytical data.
- Database connectivity: Can work with modern analytical databases and data platforms.
- Self-hosting flexibility: Allows organizations to deploy the platform within their own infrastructure.
Best For
Wren AI is best for data teams building AI-powered analytics or natural-language data experiences that need a semantic layer to provide clearer business context to underlying datasets.
#5 Malloy
Malloy is an open source data modeling language designed to bring data modeling and analytical logic closer to the code used to query and explore data. It provides a structured way to define relationships, dimensions, calculations, and reusable analytical logic.
Its approach is particularly useful for technical data teams that prefer to manage analytical definitions through code rather than relying entirely on point-and-click configuration inside a BI platform.
Malloy is not a traditional semantic layer product in the same way as Cube or a dedicated metrics-serving platform. However, its reusable data modeling approach addresses many of the same challenges around consistent definitions and governed analytical logic.
Key Features
- Code-based data modeling: Allows analytical structures and relationships to be defined through a dedicated modeling language.
- Reusable analytical logic: Helps prevent the repeated recreation of common calculations and relationships.
- Structured exploration: Provides a consistent way to describe how datasets should be queried and analyzed.
- Relationship modeling: Supports the definition of relationships between data entities.
- Version-controlled workflows: Fits naturally into software engineering and analytics engineering practices.
- Warehouse-focused analytics: Designed to work with modern analytical data environments.
Best For
Malloy is best for technical data teams that prefer a code-first approach to reusable data modeling and governed analytics logic rather than managing business definitions entirely inside a traditional BI tool.
#6 Evidence
Evidence is an open source framework for building data products, internal analytics applications, and reports using code. Although it is not a pure semantic layer, it allows teams to keep data queries, calculations, and analytical experiences closer to a software development workflow.
This makes Evidence relevant for teams that want more control over how metrics and data logic are presented in applications. Instead of building every analytical experience through a drag-and-drop BI interface, developers and analytics engineers can create data-driven pages using reusable components and version-controlled files.
For organizations building custom internal tools or external analytics experiences, Evidence can complement a broader semantic modeling strategy.
Key Features
- Code-based analytics development: Allows teams to create analytical experiences through files and development workflows.
- Reusable data queries: Helps centralize commonly used data logic across analytical pages.
- Interactive reporting: Supports the creation of data-driven reports and applications.
- Version control: Fits naturally into Git-based development environments.
- Customizable analytics experiences: Provides more flexibility than many traditional dashboard tools.
- Self-hosting capabilities: Can be deployed within an organization’s own infrastructure.
Best For
Evidence is best for teams building custom analytics applications and internal data products where reusable data logic, code-based workflows, and presentation flexibility are more important than a standalone semantic serving layer.
Increase your product visibility by reaching software buyers researching the best tools. Every submission is reviewed by our editorial team.
Feature My Tool →#7 Apache Superset
Apache Superset is one of the most widely recognized open-source analytics and BI platforms. It is not a dedicated semantic layer, but its support for reusable datasets, calculated metrics, and centralized analytical definitions makes it relevant for organizations looking to reduce duplicated logic within their BI environment.
Superset allows teams to define datasets and metrics that can be reused across charts and dashboards. This can provide a lighter-weight form of semantic consistency for organizations that primarily need to standardize analytics within the Superset ecosystem.
However, its semantic capabilities are more closely tied to the BI platform itself than the API-first or cross-tool semantic approaches offered by dedicated semantic layer tools.
Key Features
- Reusable datasets: Allows teams to create datasets that can be reused across dashboards and analytical workflows.
- Centralized metrics: Supports commonly used calculations that can be applied across charts.
- Broad database connectivity: Connects with many SQL-based databases and analytical engines.
- Self-service visualization: Provides dashboards, charts, and exploration capabilities for business users.
- SQL Lab: Gives technical users a dedicated environment for writing and testing SQL queries.
- Enterprise-scale deployment: Supports containerized and cloud-native deployment architectures.
Best For
Apache Superset is best for organizations that need an open-source BI platform with reusable datasets and metrics, particularly when semantic consistency is primarily required within the analytics and dashboard environment.
#8 Metriql
Metriql is an open source metrics layer designed to help teams define and serve business metrics independently of individual dashboards or analytics tools. Its API-oriented approach makes it relevant for organizations that want metric definitions to become a reusable part of their broader data infrastructure.
The central idea is to define metrics once and make them available to different consumers rather than rebuilding the same calculation across SQL queries and reporting platforms. This can be useful for teams looking to introduce more consistency without requiring every user to interact directly with the underlying warehouse.
As a metrics-focused project, Metriql is narrower than a complete BI platform but can fit into a composable analytics architecture.
Key Features
- Centralized metric definitions: Helps teams define commonly used business metrics in one place.
- API-first access: Makes metrics available to different analytical consumers and applications.
- Reusable business logic: Reduces the need to duplicate calculations across dashboards and queries.
- Composable architecture: Can fit into a broader modern data stack rather than replacing existing tools.
- Analytics-focused data modeling: Organizes metric logic around common analytical use cases.
- Self-hosted deployment: Gives technical teams control over infrastructure and data access.
Best For
Metriql is best for data teams looking for a focused open source metrics layer that can centralize business definitions and expose them to multiple analytics consumers.
Non-Open-Source Semantic Layer Tools and Platforms for 2026
Open source semantic layer tools are attractive when flexibility, self-hosting, and control over the data stack are priorities. However, some organizations prefer commercial platforms that provide managed infrastructure, enterprise governance, dedicated support, and more tightly integrated analytics ecosystems.
#1 Looker
Looker is one of the best-known commercial platforms associated with the semantic layer concept. Its LookML modeling language allows organizations to define relationships, dimensions, measures, and business logic centrally before making those definitions available across dashboards and analytics workflows.
Looker is best suited to larger organizations that want a mature semantic modeling environment combined with governed BI, embedded analytics, and enterprise administration.
Also Read: Looker Alternatives and Competitors
#2 AtScale
AtScale provides a semantic layer platform designed for enterprise analytics environments. It focuses on making governed business metrics and data models available across different BI tools and data platforms.
It can be particularly relevant for large organizations with multiple analytics tools, complex governance requirements, and a need to maintain consistent business definitions across distributed data environments.
#3 dbt Cloud
For organizations that want the dbt ecosystem without managing all supporting infrastructure themselves, dbt Cloud provides a managed environment for transformation workflows, collaboration, orchestration, and semantic capabilities.
It is particularly relevant for modern analytics teams that already use dbt and want a commercial platform around their analytics engineering workflow.
How to Choose the Right Open Source Semantic Layer Tool in 2026
Choosing an open source semantic layer tool should start with understanding where metric definitions currently live and who needs to consume them.
- Identify where metric inconsistency is happening: If the same KPI is calculated differently in BI dashboards, SQL queries, applications, and spreadsheets, prioritize a tool that can centralize business logic across those consumers.
- Consider your existing data transformation workflow: Teams already using dbt may benefit from a semantic layer that works closely with their existing models, while teams with a more diverse architecture may prefer an independent semantic serving layer.
- Decide who needs to consume the metrics: A semantic layer for embedded analytics may require APIs, caching, and multi-tenant controls. A layer designed mainly for internal BI may prioritize integration with dashboards and analytics tools.
- Evaluate cross-tool interoperability: If multiple BI platforms, applications, or query engines need access to the same metrics, look for an architecture that can expose definitions beyond a single analytics interface.
- Consider real-time performance requirements: Customer-facing dashboards and high-concurrency data applications may need caching, pre-aggregations, and performance optimization that are less important for internal reporting.
- Check how business logic will be maintained: Some open source semantic layer tools are code-first and work well with Git-based workflows, while others provide a more accessible interface for analytics teams.
- Review governance and access requirements: Organizations handling sensitive or tenant-specific data should evaluate how the platform supports permissions, row-level controls, and consistent access policies.
- Avoid adding a semantic layer without a clear problem: A semantic layer introduces another component into the data stack. If your current transformation and BI workflow already provides consistent metric definitions, a separate tool may add complexity without solving a meaningful problem.
Browse expertly curated software recommendations across hundreds of business categories.
Browse Top Tools →Conclusion
The best open source semantic layer tool depends on how your organization creates, manages, and consumes business metrics. Cube is a strong choice for embedded analytics and API-driven data applications, while dbt Semantic Layer and Lightdash are particularly relevant for teams already invested in the dbt ecosystem.
Wren AI introduces a different option for organizations exploring AI-powered data experiences, while Malloy, Evidence, Apache Superset, and Metriql provide alternative approaches to reusable analytical logic, governed metrics, and code-based analytics.
The right decision should ultimately come down to where your metric definitions need to be used. If the goal is to serve metrics across applications and tools, a dedicated semantic layer may be the strongest option. If the priority is governed BI, dbt integration, or analytics development, a broader open-source platform may provide a better fit.
Frequently Asked Questions
1. What are open source semantic layer tools?
Open source semantic layer tools help organizations create reusable definitions for business metrics, dimensions, entities, and relationships. These definitions can reduce inconsistencies by preventing teams from recreating the same business logic across multiple dashboards, applications, and analytics workflows.
2. What are the best open source semantic layer tools?
Some of the leading options include Cube, dbt Semantic Layer, Lightdash, Wren AI, Malloy, Evidence, Apache Superset, and Metriql. The best choice depends on whether you need embedded analytics, dbt integration, AI-assisted querying, reusable metrics, or self-service BI.
3. Is Cube a semantic layer?
Yes. Cube is a headless semantic layer that allows teams to define data models and expose governed analytical data through APIs. It is particularly popular for embedded analytics and data applications.
4. What is the difference between a semantic layer and a metrics layer?
A metrics layer generally focuses specifically on defining and governing business metrics such as revenue, churn, or conversion rate. A semantic layer can provide a broader representation of data that includes metrics, dimensions, entities, relationships, and other business concepts.
5. Does dbt have a semantic layer?
Yes. dbt provides semantic modeling capabilities designed to centralize metric definitions and connect them with dbt data models. It is particularly useful for organizations already using dbt as their analytics engineering foundation.
6. Can a semantic layer work with multiple BI tools?
Yes. One of the main reasons organizations adopt a dedicated semantic layer is to define business logic once and make it available across multiple analytics tools, applications, or other data consumers. The exact level of interoperability depends on the platform.
7. Why do companies use a semantic layer?
Companies use a semantic layer to reduce conflicting metric definitions, improve data consistency, simplify self-service analytics, and create a common understanding of business data across technical and non-technical teams.
8. Are semantic layers only useful for BI?
No. Semantic layers can also support embedded analytics, data applications, APIs, AI-powered analytics, and other systems that need access to governed business definitions.
9. Can open-source semantic layer tools support embedded analytics?
Yes. Tools such as Cube are specifically designed to support embedded analytics by providing APIs, caching, data modeling, and other capabilities needed to deliver analytical experiences inside applications.
10. What is a headless semantic layer?
A headless semantic layer separates the data modeling and metric definition layer from the visualization interface. Instead of being tied to one dashboard product, it can expose governed data through APIs for use in multiple applications or analytics tools.
11. Do small data teams need a semantic layer?
Not always. A small team with a limited number of dashboards and well-managed transformation models may not need another layer in the stack. A semantic layer becomes more valuable as the number of metrics, data consumers, BI tools, or applications increases.
12. Should you choose an open source or commercial semantic layer?
Choose an open source semantic layer when flexibility, self-hosting, customization, and architectural control are important. A commercial platform may be a better choice when managed infrastructure, enterprise support, governance, and faster implementation are higher priorities.