
The cybersecurity landscape has fundamentally shifted. What once seemed like isolated incidents has evolved into a coordinated, sophisticated threat ecosystem where attackers employ AI-driven techniques, exploit zero-day vulnerabilities, and target entire supply chains. Organizations face unprecedented risk exposure.Cybersecurity statistics reveal that 91% of enterprises experienced at least one security breach in 2025—a staggering increase from 73% just three years prior. The average cost of a data breach reached $4.88 million globally, with some breaches exceeding $50 million for large organizations. These figures underscore why cybersecurity has become a board-level priority and a strategic business imperative, not merely an IT concern.
The cybersecurity trends in 2026 reflect three critical shifts. First, ransomware attacks have evolved beyond financial extortion to include data theft and operational disruption threats. Second, cloud security challenges now dominate enterprise risk discussions as organizations accelerate cloud adoption. Third, AI and machine learning have become double-edged swords—both enhancing defensive capabilities and enabling more sophisticated attacks.
This article examines 125 critical cybersecurity statistics documenting the evolving threat landscape, enterprise vulnerabilities, investment trends, and strategic responses that define modern security strategies.
Key Cybersecurity Statistics & Trends Highlights
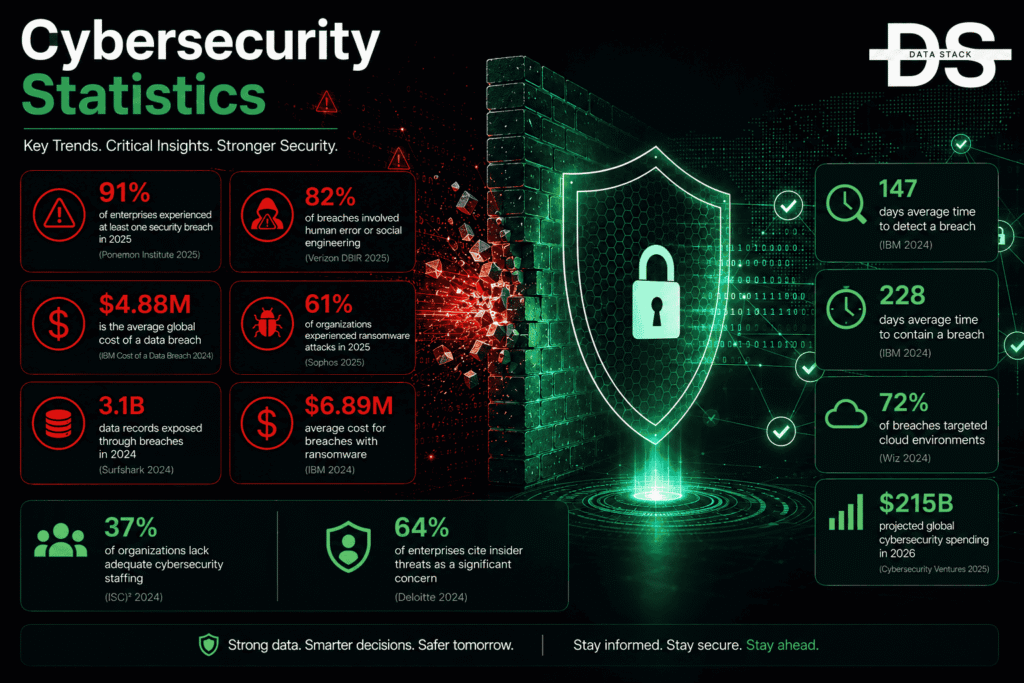
- 91% of enterprises experienced at least one security breach in 2025
- $4.88 million is the average global cost of a data breach
- 3.1 billion data records exposed through breaches in 2024
- 82% of breaches involved human error or social engineering
- $6.89 million average cost for breaches with ransomware
- 61% of organizations experienced ransomware attacks in 2025
- 147 days average time to detect a breach
- 228 days average time to contain a breach
- 72% of breaches targeted cloud environments
- $215 billion projected global cybersecurity spending in 2026
- 37% of organizations lack adequate cybersecurity staffing
- 64% of enterprises cite insider threats as significant concern
Breach Statistics & Incident Trends
1. 91% of enterprises experienced at least one security breach in 2025
2. Up from 73% in 2022
3. 3.1 billion data records exposed through breaches in 2024
Cybersecurity statistics show breach incidents have become ubiquitous rather than exceptional. Nearly all large enterprises now expect breach incidents as part of operational reality. The question has shifted from “will we be breached?” to “how quickly can we detect and respond?”
Breach Detection & Response Times
4. 147 days average time to detect a breach
5. 228 days average time to contain a breach after discovery
6. 375 days total time from breach to full containment on average
7. 23% of breaches discovered by external parties (not organization)
8. 43% of breaches took months to detect
9. 18% of breaches remained undetected for over a year
Detection delay creates compounding damage. Extended breach timelines mean attackers extract more data, establish deeper access, and inflict greater operational harm. Organizations with rapid detection (under 30 days) see 40% lower costs compared to those taking months to identify breaches.
Breach Attack Vectors & Root Causes
10. 82% of breaches involved human error or social engineering
11. 35% caused by phishing attacks
12. 28% resulted from weak or stolen credentials
13. 19% involved misconfigured cloud storage or databases
14. 16% exploited known unpatched vulnerabilities
15. 12% involved zero-day exploits
Human vulnerability remains the dominant attack vector. Cybersecurity trends show that technical controls matter, but user awareness and behavior change drive the most significant risk reduction. Organizations investing heavily in security awareness training report 70% fewer successful phishing attempts.
Ransomware Attack Statistics & Financial Impact
16. 61% of organizations experienced ransomware attacks in 2025
17. Up from 37% in 2022
18. $6.89 million average cost for breaches involving ransomware
19. 50% higher cost than non-ransomware breaches
Ransomware has evolved beyond simple encryption attacks. Modern ransomware campaigns combine encryption, data theft, and operational disruption. Organizations face choices between paying ransom (which fuels attackers), restoring from backup (time-consuming), or accepting operational losses.
Ransomware Attack Trends
20. 68% of ransomware victims paid the demanded ransom
21. $23.7 billion paid in ransoms globally in 2024
22. 42% of organizations don’t receive data after paying ransom
23. Average ransom demand: $500,000 to $5 million
24. 87% of ransomware attacks used double-extortion tactics (encryption + data theft)
25. 71% of attacks targeted healthcare or critical infrastructure
Cybersecurity statistics reveal ransomware economics favoring attackers. Even with relatively low payment rates, ransomware generates enormous criminal revenue. Healthcare organizations prove particularly vulnerable due to operational criticality and regulatory pressure to restore services rapidly.
Ransomware Detection & Prevention
26. 58% of ransomware attacks used sophisticated evasion techniques
27. 64% exploited known vulnerabilities rather than zero-days
28. 73% required initial access through compromised credentials
29. 45% of organizations lack proper backup and disaster recovery
30. 31% test backup restoration less than annually
Prevention requires layered defense. Organizations protecting against ransomware invest in credential security, patch management, network segmentation, and tested backup strategies—addressing the actual attack progression rather than just the final encryption stage.
Cloud Security & Breach Statistics
31. 72% of breaches targeted cloud environments
32. Up from 41% in 2021
33. $5.2 million average cost of cloud security breaches
34. 19% higher cost than on-premises breaches
Cloud adoption accelerates faster than security maturity. Organizations migrating to cloud often replicate on-premises security models designed for different architectures. Cloud-native security requires different approaches: identity-based access, zero trust models, and continuous monitoring rather than perimeter defense.
Cloud Misconfiguration & Exposure
35. 67% of cloud breaches caused by misconfiguration
36. 43% of organizations experienced public cloud storage exposure
37. 52% of exposed databases contained sensitive data without encryption
38. 28% of cloud workloads have excessive permissions
39. 74% of organizations lack complete visibility into cloud resources
Cloud misconfiguration represents the biggest cloud security vulnerability. Simple mistakes—enabling public access, weak identity controls, missing encryption—create massive exposure. Organizations lacking cloud asset visibility can’t secure what they don’t see.
Cloud Provider Security Responsibility
40. 56% of organizations misunderstand shared responsibility model
41. 64% believe cloud providers fully secure their data
42. 38% don’t encrypt data in transit or at rest in cloud
43. 71% lack formal cloud security policies
Cybersecurity statistics reveal a dangerous confidence gap. Organizations delegate too much security responsibility to cloud providers, who secure infrastructure but not customer data or application configuration. This misalignment creates exploitable gaps.
Data Breach Cost & Financial Impact Statistics
44. $4.88 million average global cost of a data breach
45. Up from $3.61 million in 2021
46. 35% increase over five-year period
Breach Cost Breakdown
47. Detection and analysis: $1.44 million average
48. Notification and legal: $860,000 average
49. Lost business and downtime: $1.58 million average
50. Breach response and recovery: $1.02 million average
Cybersecurity statistics show operational costs dominate breach expenses. Direct forensics and notification costs represent only 30-40% of total impact. Lost productivity, customer churn, and brand damage constitute 60-70% of total breach cost.
Breach Cost By Industry
51. Healthcare: $10.93 million average cost (highest)
52. Financial services: $5.72 million average
53. Technology: $4.36 million average
54. Retail: $3.84 million average
55. Manufacturing: $4.29 million average
Healthcare faces disproportionate breach costs due to operational criticality, regulatory complexity, and patient privacy sensitivity. A single healthcare breach can disrupt patient care, trigger massive legal liability, and damage institutional reputation irreparably.
Breach Cost By Organization Size
56. Large enterprises (>10,000 employees): $6.45 million average
57. Mid-market (1,000-10,000): $4.12 million average
58. Small organizations (<1,000): $2.84 million average
59. SMBs often underestimate breach impact by 40-60%
60. 60% of SMBs go out of business within one year of major breach
Cybersecurity statistics show breach economics differ dramatically by organization size. Large enterprises absorb costs across revenue base; small organizations face existential threats. This disparity creates concerning cybersecurity liability for SMBs.
Threat Landscape & Emerging Attack Techniques
61. 42% of organizations report increased AI-powered attacks
62. 57% observed more sophisticated phishing attacks in 2025
63. 38% detected supply chain attacks targeting them
64. 51% experienced business email compromise attempts
Cybersecurity trends show attackers rapidly adopt emerging technologies. AI enhances reconnaissance, enables targeted phishing at scale, and automates vulnerability discovery. Supply chain attacks continue expanding as attackers realize direct defense can be difficult but vendor relationships are often weaker.
Advanced Persistent Threat (APT) Activity
65. 73% of enterprises targeted by advanced persistent threats
66. 68% believe they’re currently compromised by APTs
67. Average APT dwell time before discovery: 284 days
68. 31% of APT incidents discovered by external parties
69. 45% of APTs aimed at intellectual property theft
70. 38% targeted operational technology and critical infrastructure
APT statistics reveal patient, well-funded attackers establishing long-term access for espionage or disruption. Extended dwell times indicate detection gaps. Many compromises remain undiscovered indefinitely, raising questions about how many breaches go entirely undetected.
Insider Threat & Human Risk Statistics
71. 64% of organizations cite insider threats as significant concern
72. 34% experienced insider threat incidents in past 12 months
73. 67% of insider threats involved employee negligence
74. 21% involved deliberate employee sabotage
75. 12% involved third-party/contractor misuse
Insider threats split between negligent mistakes and deliberate malfeasance. Cybersecurity statistics show employee monitoring and access controls matter, but cultural factors (morale, engagement, loyalty) correlate more strongly with insider risk than purely technical controls.
Insider Threat Impact
76. Average insider threat incident costs $15,400
77. But data theft incidents average $600,000+
78. 76% of insider incidents detected through user/activity monitoring
79. 52% of organizations lack insider threat detection tools
80. 41% of employees would consider selling company data for money
Insider threat costs vary dramatically by incident type. Simple policy violations cost little; data theft causes massive damage. Organizations balancing insider threat detection with employee privacy face genuine tension between security and trust.
Vulnerability & Patch Management Statistics
81. 64% of breaches exploited known vulnerabilities
82. Average time from vulnerability disclosure to exploitation: 28 days
83. 45% of organizations can’t patch vulnerabilities within 30 days
84. 21,862 new vulnerabilities identified in 2024
85. 2,800+ zero-day vulnerabilities estimated active in wild
Cybersecurity statistics reveal patching as both a solved and unsolved problem. Organizations know about patches but struggle with deployment velocity. Legacy systems, testing requirements, and operational constraints prevent rapid patching despite known risks.
Vulnerability Management Practices
86. 31% of organizations conduct vulnerability scans quarterly or less
87. 58% lack formalized vulnerability management programs
88. 43% don’t prioritize patching by vulnerability severity
89. 71% struggle with tracking vulnerable infrastructure
90. 52% of organizations underestimate their vulnerability exposure
Many organizations lack basic vulnerability discipline. Infrequent scanning, poor prioritization, and incomplete asset visibility create persistent exposures. This represents one of cybersecurity’s most frustrating paradoxes: preventable breaches through known vulnerability exploitation despite available patches.
Compliance & Regulatory Challenges
91. 73% of organizations cite regulatory compliance as major cybersecurity driver
92. 58% report compliance requirements complicate security decisions
93. GDPR fines reaching €50 million or 4% of global revenue for violations
94. CCPA violations carrying $2,500-$7,500 per consumer per incident
95. 67% of organizations operate across multiple regulatory regimes
Cybersecurity statistics show compliance complexity increasing. Organizations managing multiple regulations (GDPR, CCPA, HIPAA, SOX, industry-specific standards) face conflicting requirements and substantial penalty risk. This creates organizational tension between pragmatic security and perfect compliance.
Compliance Burden & Cost
96. Organizations spend average $1.2 million annually on compliance
97. 43% of security budget directed toward compliance requirements
98. 31% report compliance requirements don’t improve actual security
99. 52% lack adequate audit and assessment capacity
100. 41% fail compliance audits despite compliance intentions
Cybersecurity statistics reveal the compliance-security paradox. Heavy compliance spending doesn’t guarantee security. Organizations excel at meeting checklist requirements while remaining vulnerable to actual attacks. True security requires moving beyond compliance theater toward risk-based decision-making.
Cybersecurity Staffing & Talent Challenges
101. 37% of organizations report inadequate cybersecurity staffing
102. 3.4 million unfilled cybersecurity positions globally
103. 85% of security professionals report burnout
104. Average cybersecurity salary: $102,000 base
105. Senior security architect salary: $165,000-$220,000
Cybersecurity staffing crisis intensifies as demand outpaces supply. Security professionals face burnout from alert fatigue, on-call requirements, and constant escalation. This talent shortage forces organizations toward automation, outsourcing, and managed security services.
Security Skills Gaps
106. 68% of security teams report insufficient incident response expertise
107. 71% lack advanced threat hunting skills
108. 64% report inadequate cloud security expertise
109. 58% struggle with security automation implementation
110. 42% report insufficient AI/ML security skills
Cybersecurity talent gaps concentrate in specialized areas. Incident response, threat hunting, and emerging technology expertise command premium salaries and remain perpetually undersupplied. This forces organizations toward outsourced expertise or accepting capability gaps.
Cybersecurity Investment & Spending Trends
111. $215 billion global cybersecurity spending projected for 2026
112. 12.3% annual growth rate (2022-2026)
113. Cloud security spending growing at 21.4% annually
114. AI-powered security tools spending growing at 28.7% annually
115. Organizations allocate average 9.4% of IT budget to cybersecurity
116. Large enterprises allocate 12-15% of IT budgets
117. SMBs allocate 4-6% of IT budgets
Cybersecurity statistics show rising investment amid persistent talent and capability gaps. Organizations spend more on tools, platforms, and services hoping technology compensates for staffing shortages. Yet spending growth hasn’t eliminated breach increases, raising questions about deployment effectiveness.
Security Budget Allocation
118. Endpoint security and detection: 18% of security budgets
119. Network security and firewalls: 16%
120. Compliance and governance: 14%
121. Cloud security: 13%
122. Incident response and forensics: 11%
123. Security operations center (SOC): 15%
124. Training and awareness: 7% (significantly underinvested)
125. Other/emerging technologies: 6%
Cybersecurity spending prioritizes technical solutions over human factors. Training and awareness represent less than 10% of budgets despite human error driving 82% of breaches. This budget misalignment suggests organizations over-invest in tools while under-investing in behavioral change where greatest risk reduction occurs.
Future Cybersecurity Outlook & 2026 Predictions
Cybersecurity trends point toward continued escalation. AI-powered attacks will advance faster than defenses. Supply chain threats will expand as attackers exploit weakest links. Cloud breaches will dominate incident statistics as adoption accelerates faster than security maturity.
Organizations face difficult choices: invest heavily in internal capabilities (expensive, time-consuming) or embrace outsourced security through managed service providers and cloud-native protections. Many will pursue hybrid approaches, combining internal expertise for strategic risks with outsourced management for operational security.
The cybersecurity statistics of 2026 will likely show continued breach increases despite investment growth. This reflects the fundamental asymmetry: defenders must prevent every attack; attackers need only succeed once. Until organizations shift from breach prevention (impossible) toward rapid detection and response (achievable), statistics will continue showing deterioration despite rising spend.
Frequently Asked Questions
1. What Is The Most Common Cause Of Data Breaches?
Human error and social engineering account for 82% of breaches according to cybersecurity statistics. Phishing emails, weak passwords, and misconfigurations represent the dominant attack vectors. Technical controls matter, but user awareness and behavior change drive the most significant risk reduction.
2. How Long Does It Take To Detect A Breach On Average?
Cybersecurity statistics show the average detection time is 147 days. However, this masks significant variation: organizations with advanced monitoring detect breaches in days; those relying on external discovery wait months or years. Rapid detection significantly reduces breach costs.
3. What Is The Average Cost Of A Data Breach?
The global average is $4.88 million, but cybersecurity statistics show enormous variation by industry and size. Healthcare breaches average $10.93 million; retail averages $3.84 million. Large enterprises see higher absolute costs; small organizations face proportionally larger impacts.
4. Are Cloud Environments More Or Less Secure Than On-Premises?
Cybersecurity statistics show cloud environments aren’t inherently more or less secure—they’re differently secured. Cloud providers excel at infrastructure security but shift application and data responsibility to customers. Misconfiguration (39% of cloud breaches) often stems from users unfamiliar with cloud-native security models.
5. How Effective Is Ransomware Defense?
Cybersecurity statistics show organizations using proper backup, disaster recovery, and segmentation prevent 80%+ of ransomware damage. However, only 45% of organizations maintain proper backups; of those, 31% never test restoration. This creates dangerous confidence gaps.
6. What Percentage Of Organizations Experience Breaches?
Cybersecurity statistics show 91% of large enterprises experienced at least one breach in 2025. This near-universal rate indicates breaches are now expected operational incidents rather than exceptional events. The focus has shifted from prevention to rapid detection and response.
7. Are Larger Organizations More Targeted Than Smaller Ones?
Cybersecurity statistics show both patterns: larger organizations attract sophisticated targeted attacks; smaller organizations face high-volume automated attacks. Large enterprises suffer higher absolute costs; SMBs face proportionally larger business impact. Both face serious risk.
8. How Often Should Organizations Patch Systems?
Cybersecurity statistics show attackers typically exploit known vulnerabilities within 28 days of disclosure. Organizations should target 30-day patch cycles for critical vulnerabilities. However, 45% of organizations can’t achieve this velocity due to legacy systems, testing requirements, and operational constraints.
9. What Percentage Of Organizations Have Cybersecurity Insurance?
Cybersecurity statistics show approximately 68% of large enterprises now carry cyber liability insurance. Premiums have increased 15-30% annually as insurers recalibrate risk. Insurance helps but doesn’t replace strong security practices.
10. What Should Organizations Prioritize For Maximum Breach Reduction?
Cybersecurity statistics indicate the greatest risk reduction comes from: (1) Rapid breach detection (reduces dwell time and damage), (2) Access control and credential security (addresses 28% of breaches), (3) Employee security awareness (addresses 82% of breaches through human factors), (4) Backup and disaster recovery (prevents ransomware damage). Technology matters, but these fundamentals drive results.
Sources & References
- IBM Security: Cost of a Data Breach Report (2025)
- Verizon Data Breach Investigations Report (2025)
- CrowdStrike Global Threat Report (2026)
- Palo Alto Networks: 2025 Unit 42 Threat Report
- CISA: Annual Cybersecurity Report (2025)
- Gartner: Magic Quadrant for Security Analytics (2025)
- Forrester: State of Enterprise Security (2025)
- McKinsey: The Evolution of Cyber Resilience (2025)
- Deloitte: Global Apparel, Fashion & Luxury Travel Industries Cybersecurity (2025)
- IDC: Global Cybersecurity Spending Forecast (2026)
- Statista: Cybersecurity Statistics & Trends (2024-2026)
- Mandiant: M-Trends Threat Intelligence Report (2025)
- Accenture: Cost of Cybercrime (2025)
- ADP Research Institute: Insider Threat Report (2025)
- Ponemon Institute: Breach Response & Recovery Survey (2024)
- SecurityWeek: CISO Priorities & Spending Report (2026)
- Cloud Security Alliance: Cloud Security Report (2025)
- Fortinet: Global Threat Landscape Report (2025)
- Splunk: Security Outcome Study (2025)
- Unit 42: Threat Intelligence Report (2025)